The ECOAT Core
User Guide
Everything you need to work in Core — production, quality, inventory, lab, maintenance, and more — in one place, for every facility.
⭳ Download this guide as PDFContents
- 01Getting Started & Home
- 02Quality (QMS)
- 03Inventory
- 04Lab
- 05Production
- 06Motor Line
- 07Maintenance
- 08Safety
- 09ZNET
- 10IT
- 11Admin & Feedback
Getting Started & Home
Getting Started & Home
Welcome to ECOAT Core — the single platform your plant and office run on every day. This chapter gets you signed in, gives you the lay of the land on the Home dashboard, and shows you the handful of tools that work the same on every page: the facility selector, the menu, quick search, Help, and the Feedback button.
Signing In
Core uses your my.ecoat.us account — the same login you use for other ecoat.us tools. There's no separate password to remember.
- Go to the Core web address (bookmark it, or ask IT for the link).
- Click Sign in with my.ecoat.us.
- Enter your my.ecoat.us email and password if prompted.
- You'll land on the Home dashboard.
Tip: Core remembers you between visits, so you usually won't have to sign in every time on the same device. If a page ever looks empty or "logged out," refresh and sign in again.
Permissions: What you can see is tied to your account. Two people can open the same app and see different menus — that's normal. Modules you don't have access to simply don't appear. If you're missing something you need, send Feedback (see below) or ask IT.
The Home Dashboard
Home is your morning starting point. It greets you by name, surfaces anything that needs a human right now, and gives you a card for each module you have access to. It refreshes automatically when you switch facilities.
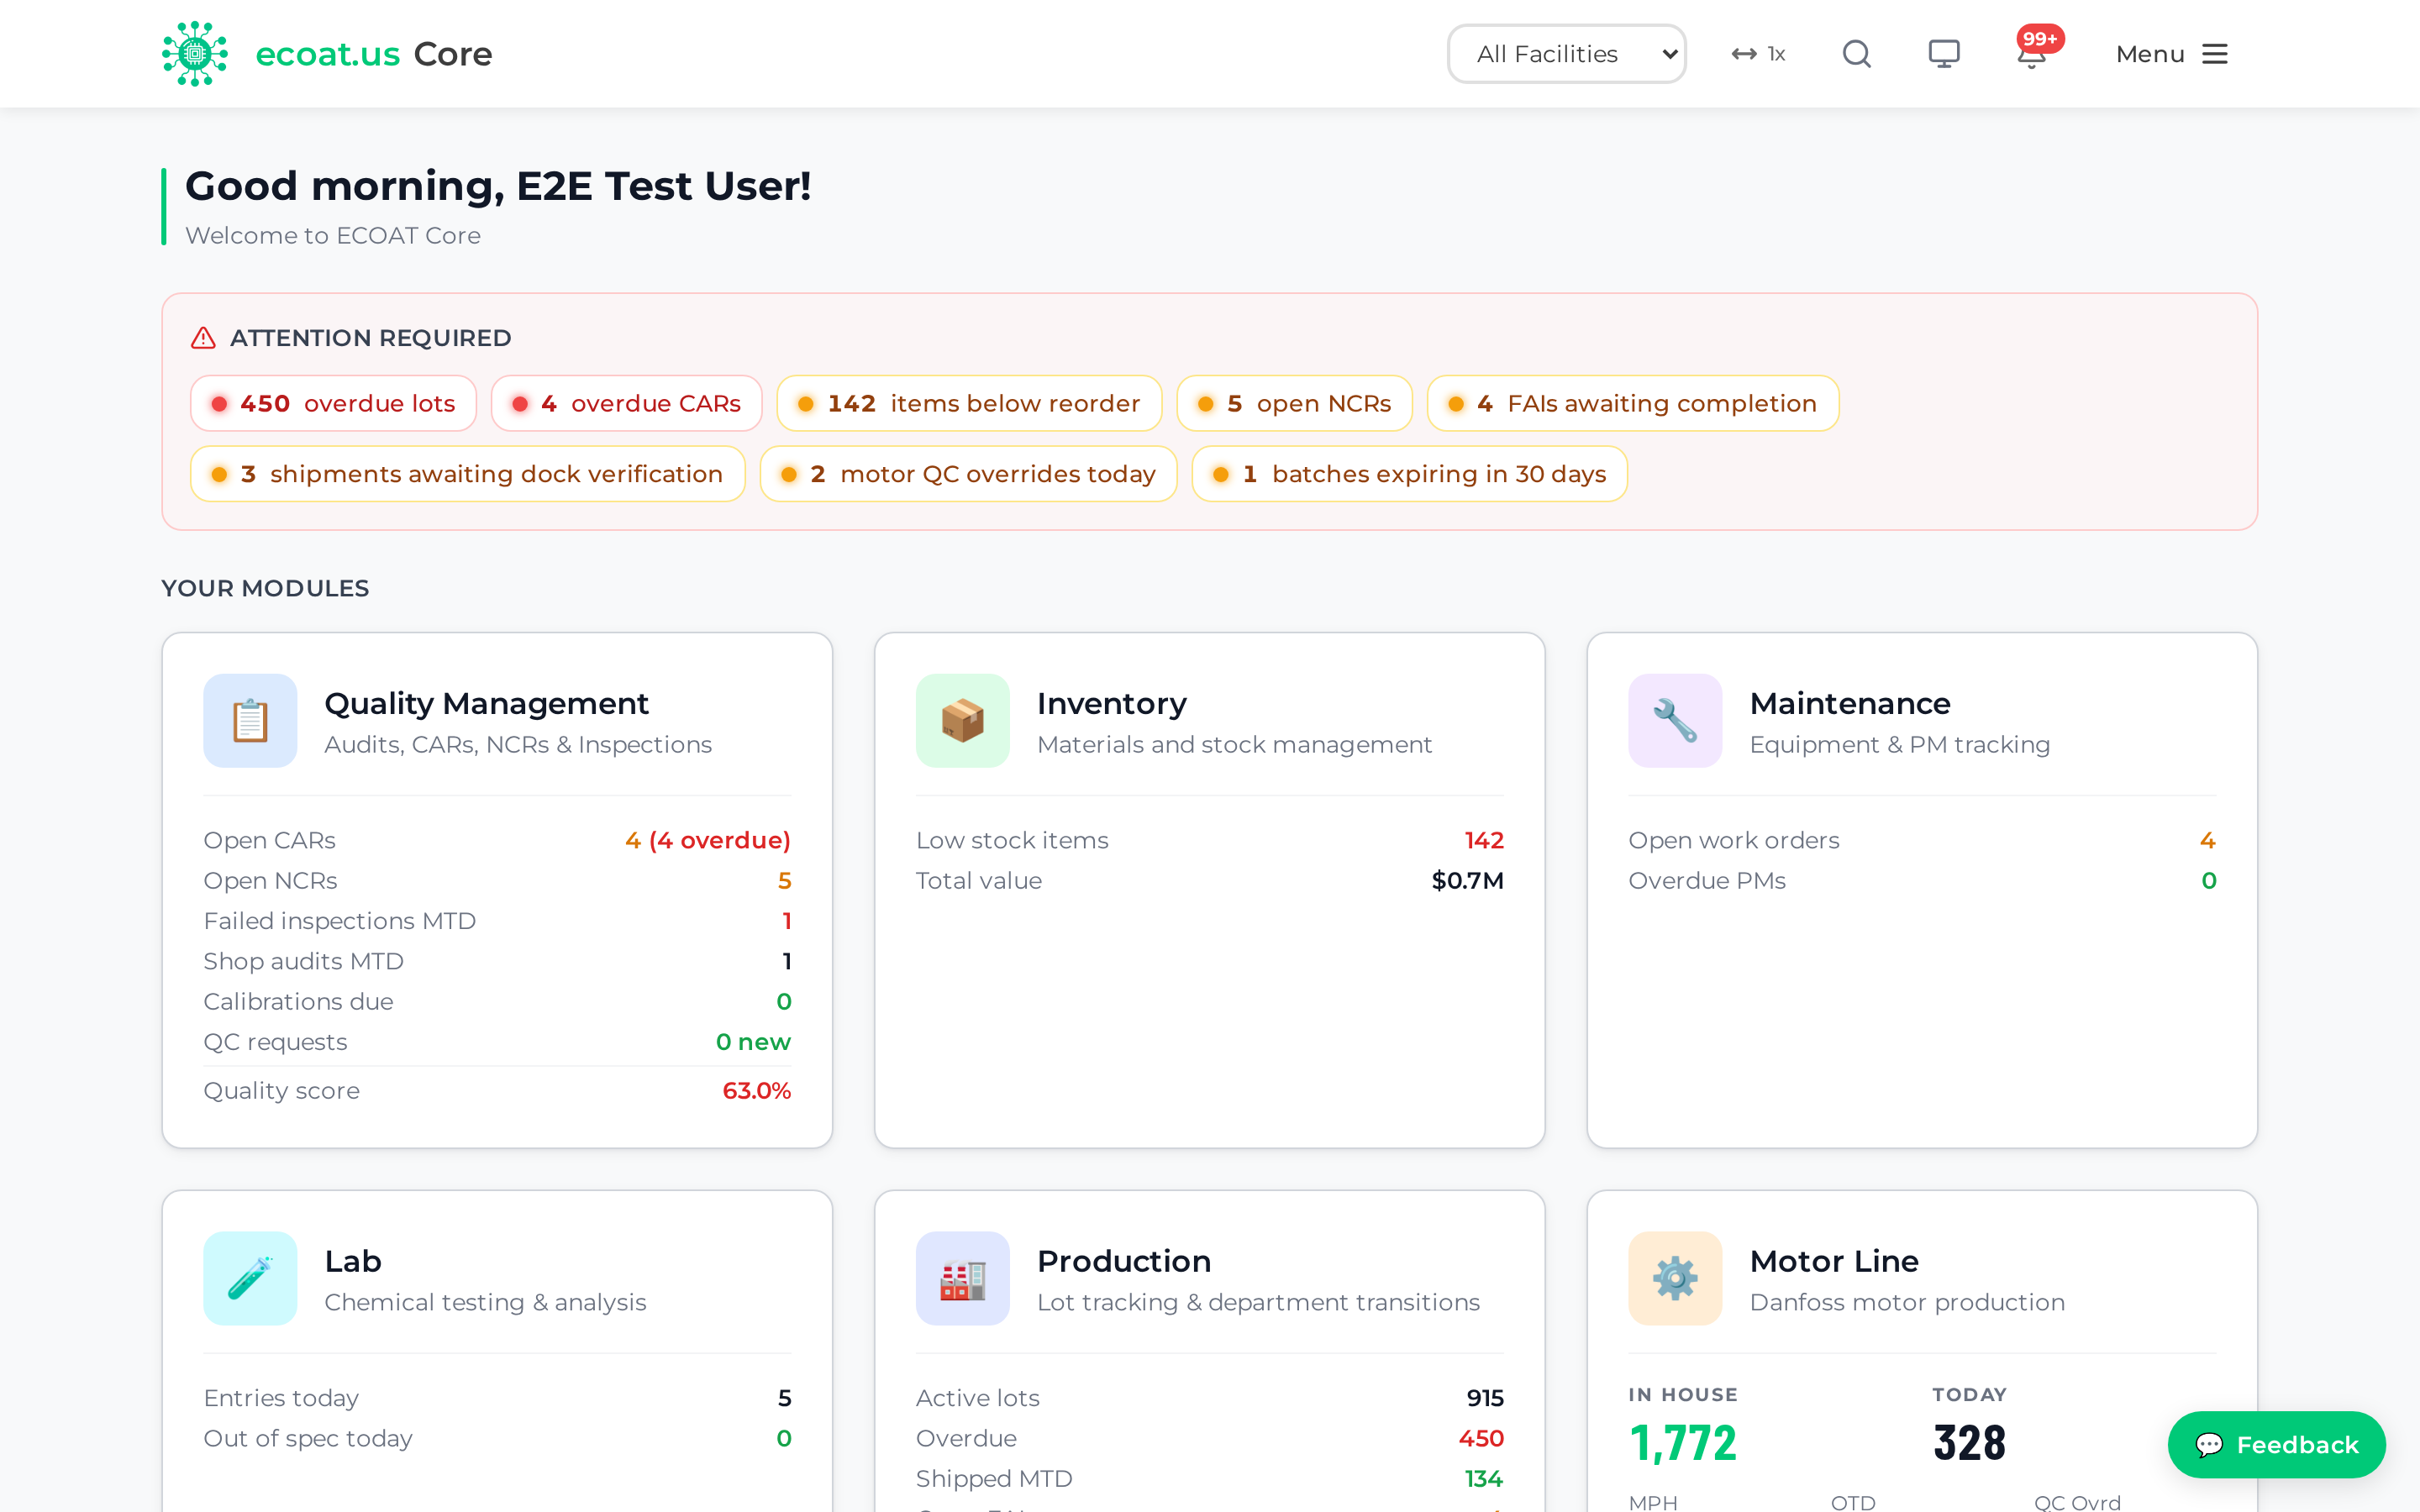
From top to bottom, Home shows:
- Greeting — "Good morning/afternoon/evening, [your name]."
- Attention rail — the page's headline. A row of numbered call-outs for things that need action: overdue CARs, open NCRs, calibrations overdue or due soon, new QC requests, lab readings out of spec, items below reorder, batches expiring soon, overdue PMs, overdue lots, and more. Red means urgent, amber means soon. Click any item to jump straight to it.
- IT Announcements — messages from IT (see below). Dismiss one with the × and it stays dismissed on that device.
- Your Modules — a card per module (Quality, Inventory, Maintenance, Lab, Production, and so on). Each card shows a few live numbers and links to that module.
- System Status — API health, the current Core version, and running totals like items tracked and equipment count.
- Quick Actions — shortcuts to the things you do most, tailored to your role.
Tip: If the attention rail is empty, there's nothing urgent for you right now — that's a good thing. Skim it first each morning before diving into a module.
Announcements
Announcements are how IT tells everyone about planned maintenance, outages, or important changes. They appear at the top of Home, colour-coded by type (info, warning, critical, maintenance). Dismissing one only hides it for you — it doesn't remove it for anyone else.
The Facility Selector
Core serves four working facilities — Seminole, Tulsa, Cleveland, and Mission — and most screens are scoped to one at a time. The facility dropdown sits in the top bar and is always visible.
- Pick a facility to see only its data.
- If your account covers more than one site, you'll also have an All Facilities option.
- Your choice follows you as you move between pages, and Home re-loads its numbers to match.
You may also see a fifth entry, Testopia, TX. Testopia is a demo facility — a fictional plant with invented lots, items, and readings, kept so people can practise and be trained on real screens without touching live work. Its numbers are deliberately excluded from every corporate roll-up. If you're not training or demonstrating, ignore it.
Tip: If a list looks empty or a number seems wrong, check the facility dropdown first — you may be looking at a different site than you expected. When a specific facility is selected, Core also hides modules that facility doesn't use.
Getting Around: the Menu
The Menu button in the top-right corner opens the main navigation. It lists every module you have access to — Home, QMS, Inventory, Maintenance, Lab, Production, and any others. Your signed-in name and the Logout button live here too.
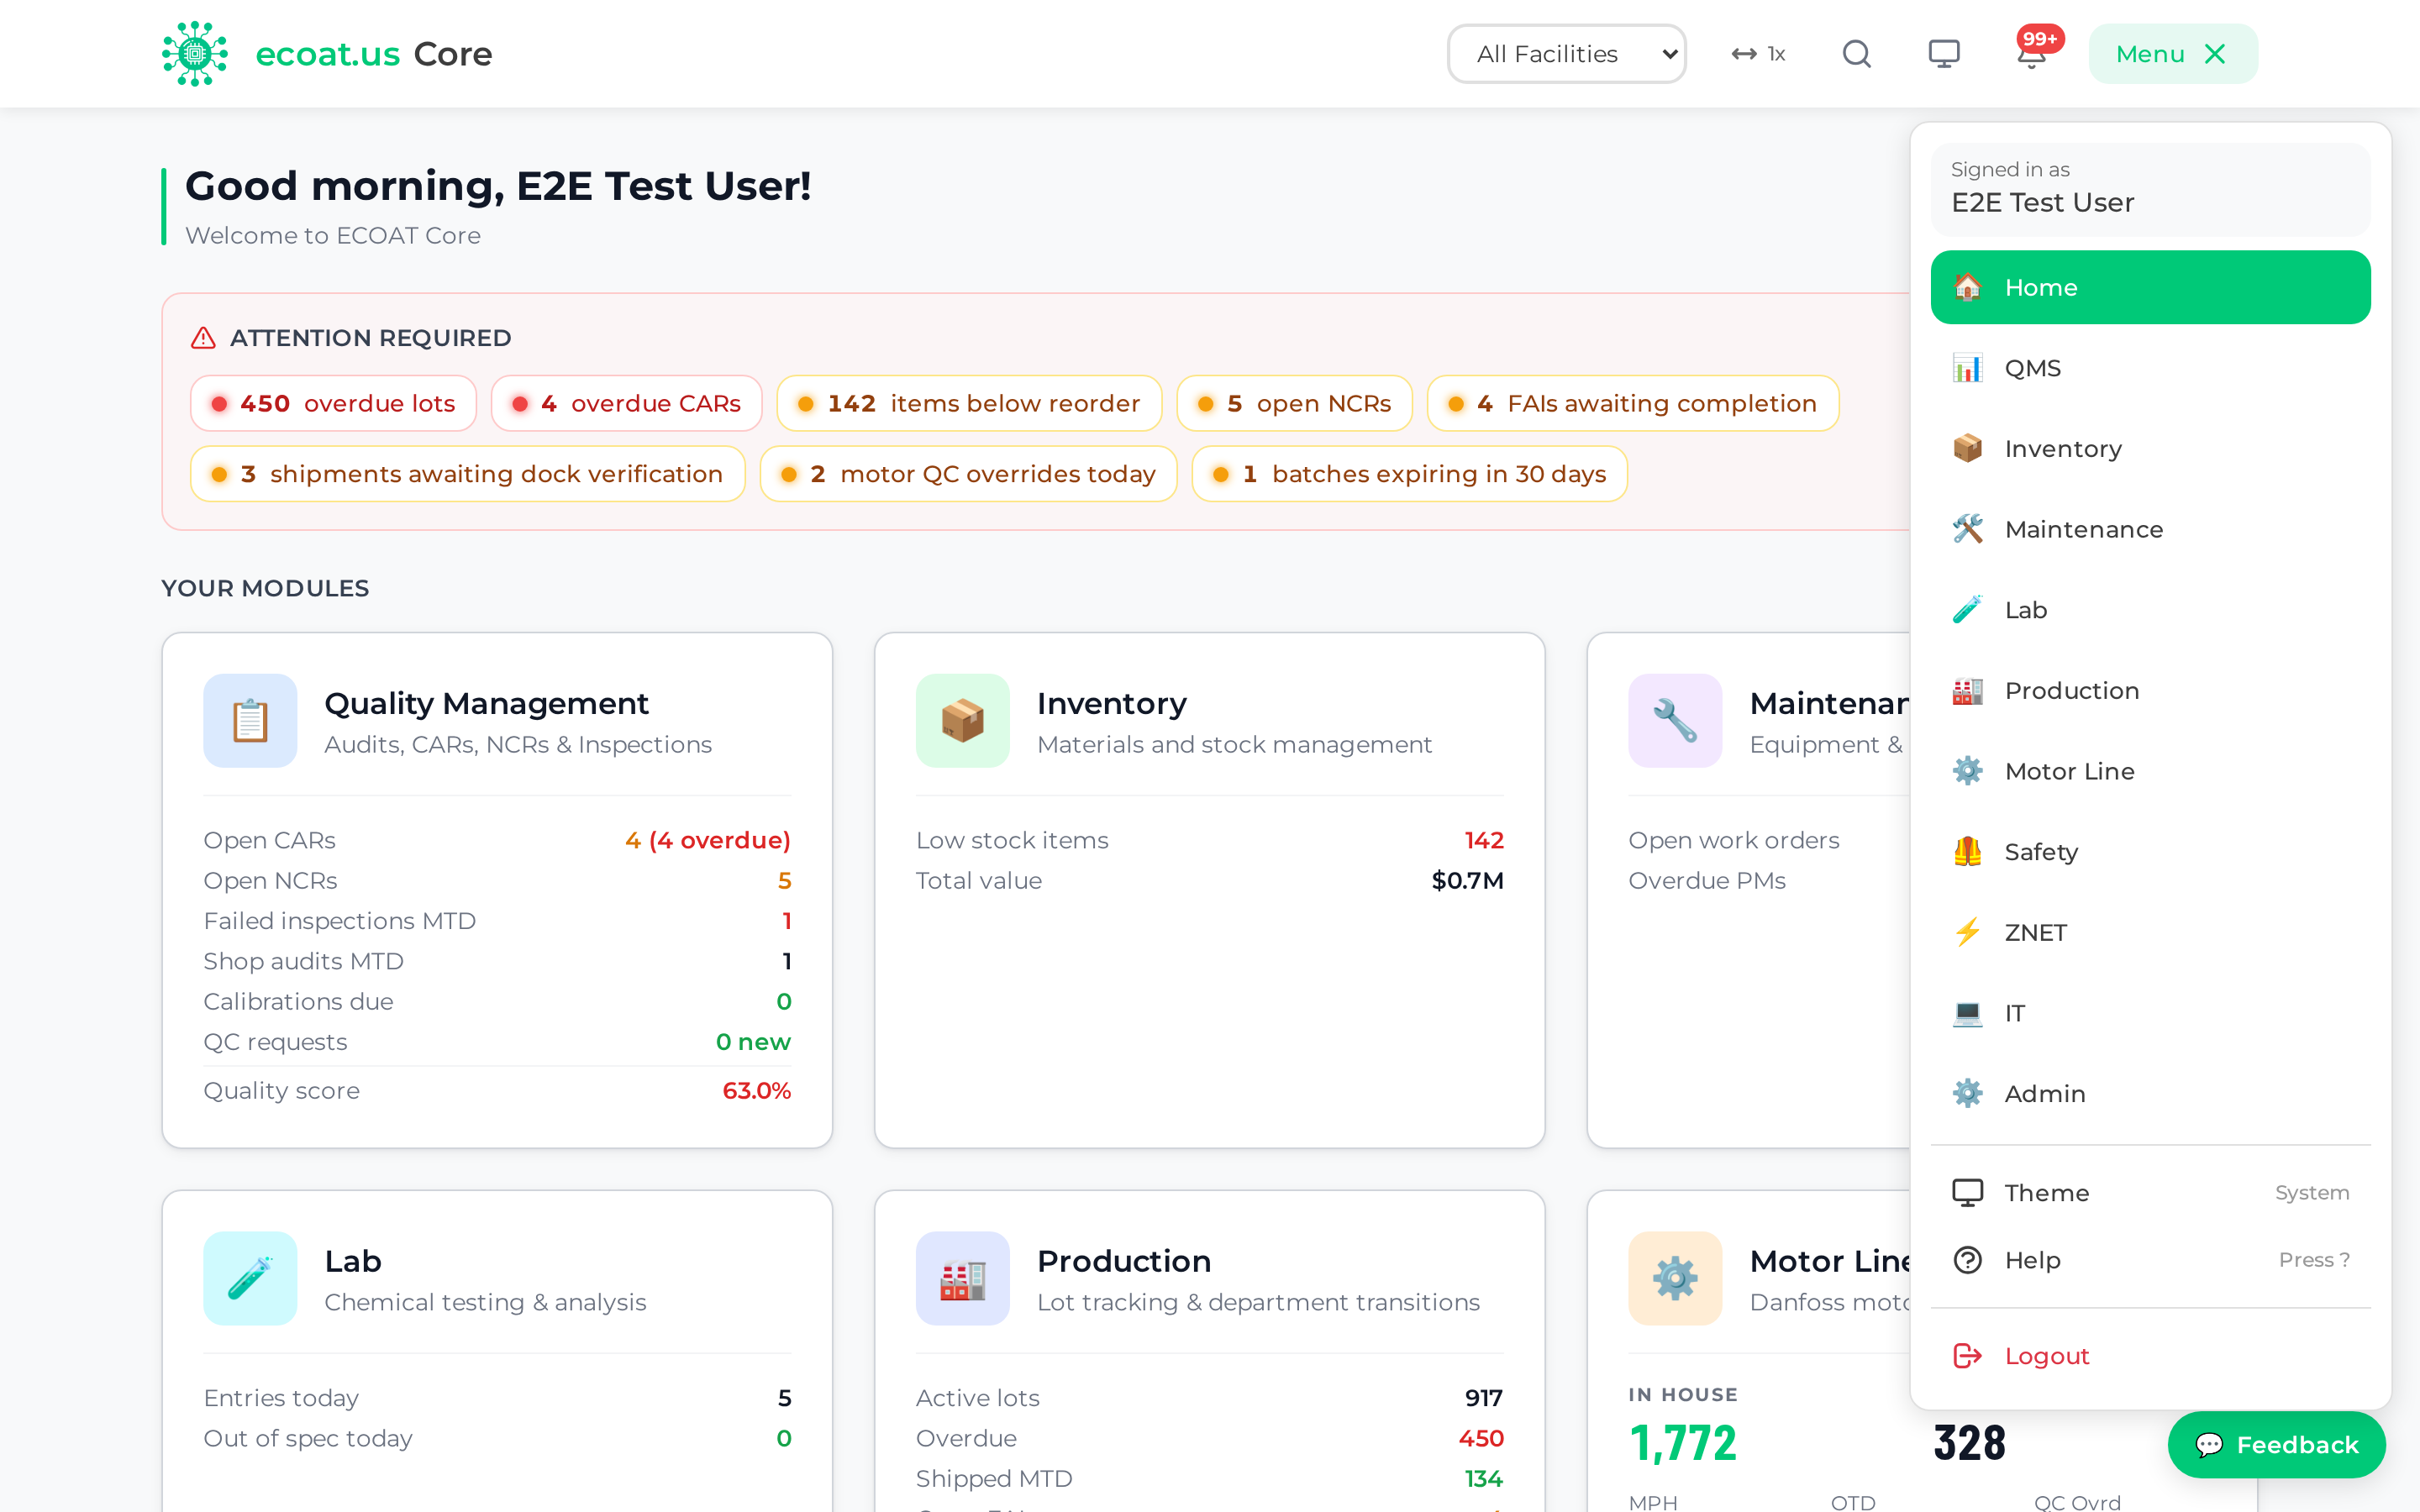
- Click Menu (top-right).
- Pick a module.
- Inside a module, a sub-navigation bar appears under the header with that module's pages (for example, QMS shows Dashboard, ISO Audits, Calibrations, CAR, NCR, and so on).
Some modules tuck their setup pages into a ⚙ Configure dropdown at the end of the sub-nav to keep the bar tidy. A sub-nav link with an outward arrow (↗) opens in a new tab.
The theme toggle (light / dark / match your system) also lives in the menu on phones, and in the top bar on larger screens.
Working in Spanish
Core's screens are available in English and Spanish (Mexican Spanish). One language is active at a time, and switching is a single click.
Switching language
- On a computer, the language button sits in the top bar next to the theme toggle. It shows the language you're in — EN or ES — and hovering it tells you which language you'd be switching to.
- On a phone or a narrow window, open Menu and use the Language row; it shows the current language on the right (English / Español (México)).
- The button's own labels are always shown in both languages' own names, so you can find your way back even if the screen you're on is in a language you don't read.
Switching reloads the page. That's deliberate — the whole app changes over at once rather than half of it. Anything you were part-way through typing should be saved first.
What Core remembers
- Your choice is remembered in that browser on that device. Sign in on a different tablet, phone, or computer and set it there too.
- If your browser or device is already set to Spanish, Core opens in Spanish the first time, without you doing anything. Any Spanish setting counts (
es,es-MX,es-419— they all land on Mexican Spanish).
Pinning a tablet or kiosk to one language
Add ?lang=es-MX to the end of the address, for example:
https://core.ecoat.us/production/lots?lang=es-MX
Opening that address once sets the language and remembers it, so you can bake it into a shop-floor tablet's home page or a bookmark and the station stays in Spanish from then on. ?lang=en does the same in the other direction.
Searching in either language
Quick search (Ctrl+K, below) indexes page names in both languages at once. Someone who has typed "cycle count" for a year still finds the page with the interface in Spanish, and a Spanish speaker finds it by typing "conteo" — you don't have to switch back to search.
What stays in English
Be aware of the edges — this is a translated interface, not a translated plant:
- Printed and exported documents stay in English. Travelers, labels, certificates, BOLs, and the report exports (CSV / Excel / PDF) are built on the server and come out in English regardless of your setting.
- A few words on screen stay in English on purpose. Department and stage names, single-select options, and similar values are stored data, not labels — Core matches on the exact English text to route a lot and to spot QC holds. Translating them would silently mis-route work, so they are deliberately left alone.
Jump to Any Page: Quick Search (Ctrl+K)
Core has around 90 pages. Instead of hunting through menus, press Ctrl+K (or ⌘K on a Mac) to jump straight to any of them. You can also click the magnifying-glass icon in the top bar.
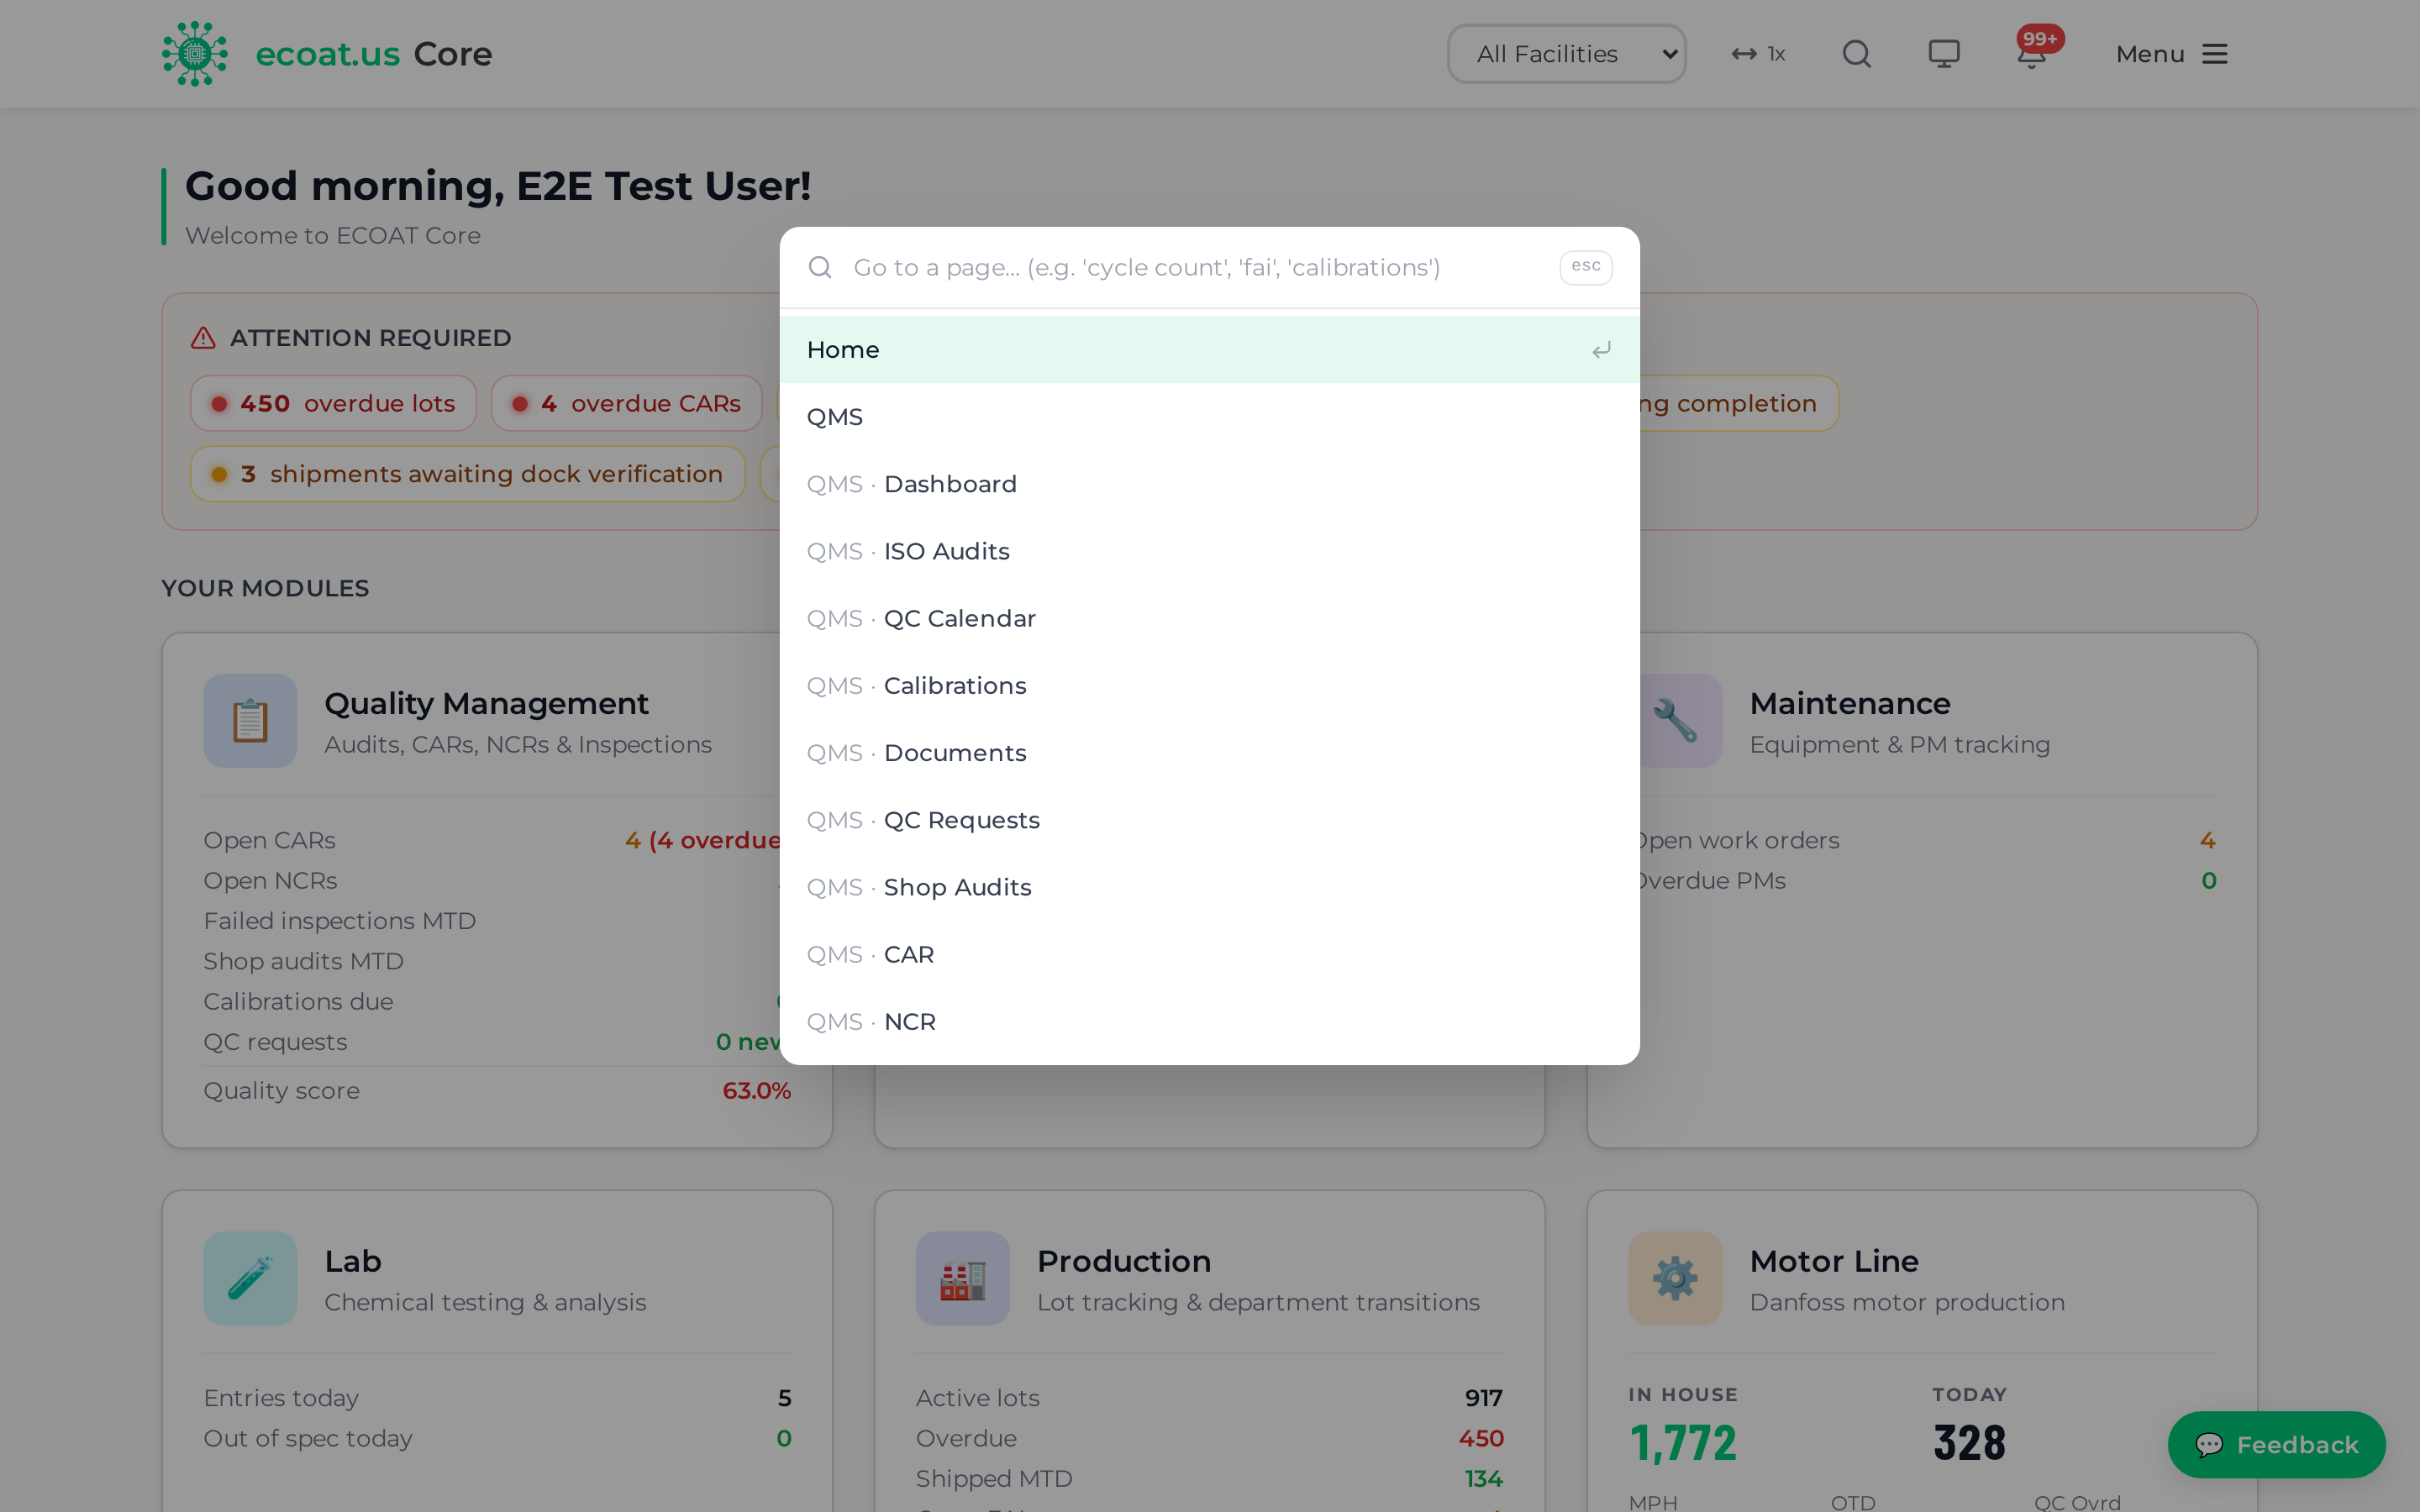
- Press Ctrl+K.
- Start typing — a page name, or part of one (e.g. "cycle count", "fai", "calibrations").
- Use the arrow keys to move up and down the results.
- Press Enter to go there. Press Esc to close.
Results are filtered to what your account can open, so you'll only ever be offered pages you're allowed to see.
Important: Quick search is built from the menu. It lists the modules and sub-nav pages you have access to — and nothing else. A handful of real, working pages have no menu entry of their own and therefore never appear in quick search, no matter what your permissions are. Today that includes the Production Run List and Processes pages, the standalone BOL and Ship Verify addresses, Facility Contacts, GL Codes, Notification Preferences, and Maintenance ▸ Mechanical.
So an empty result is not proof that you lack access. Each of those pages is reached by a button somewhere else in Core (this guide says where in the relevant chapter). Try that route first; if you still can't get in, then send Feedback or ask IT.
Getting Help: Press ?
Every page has built-in help. Press the ? key anytime to open it (or choose Help from the Menu). The Help window has step-by-step guides organized by module, with a search box.
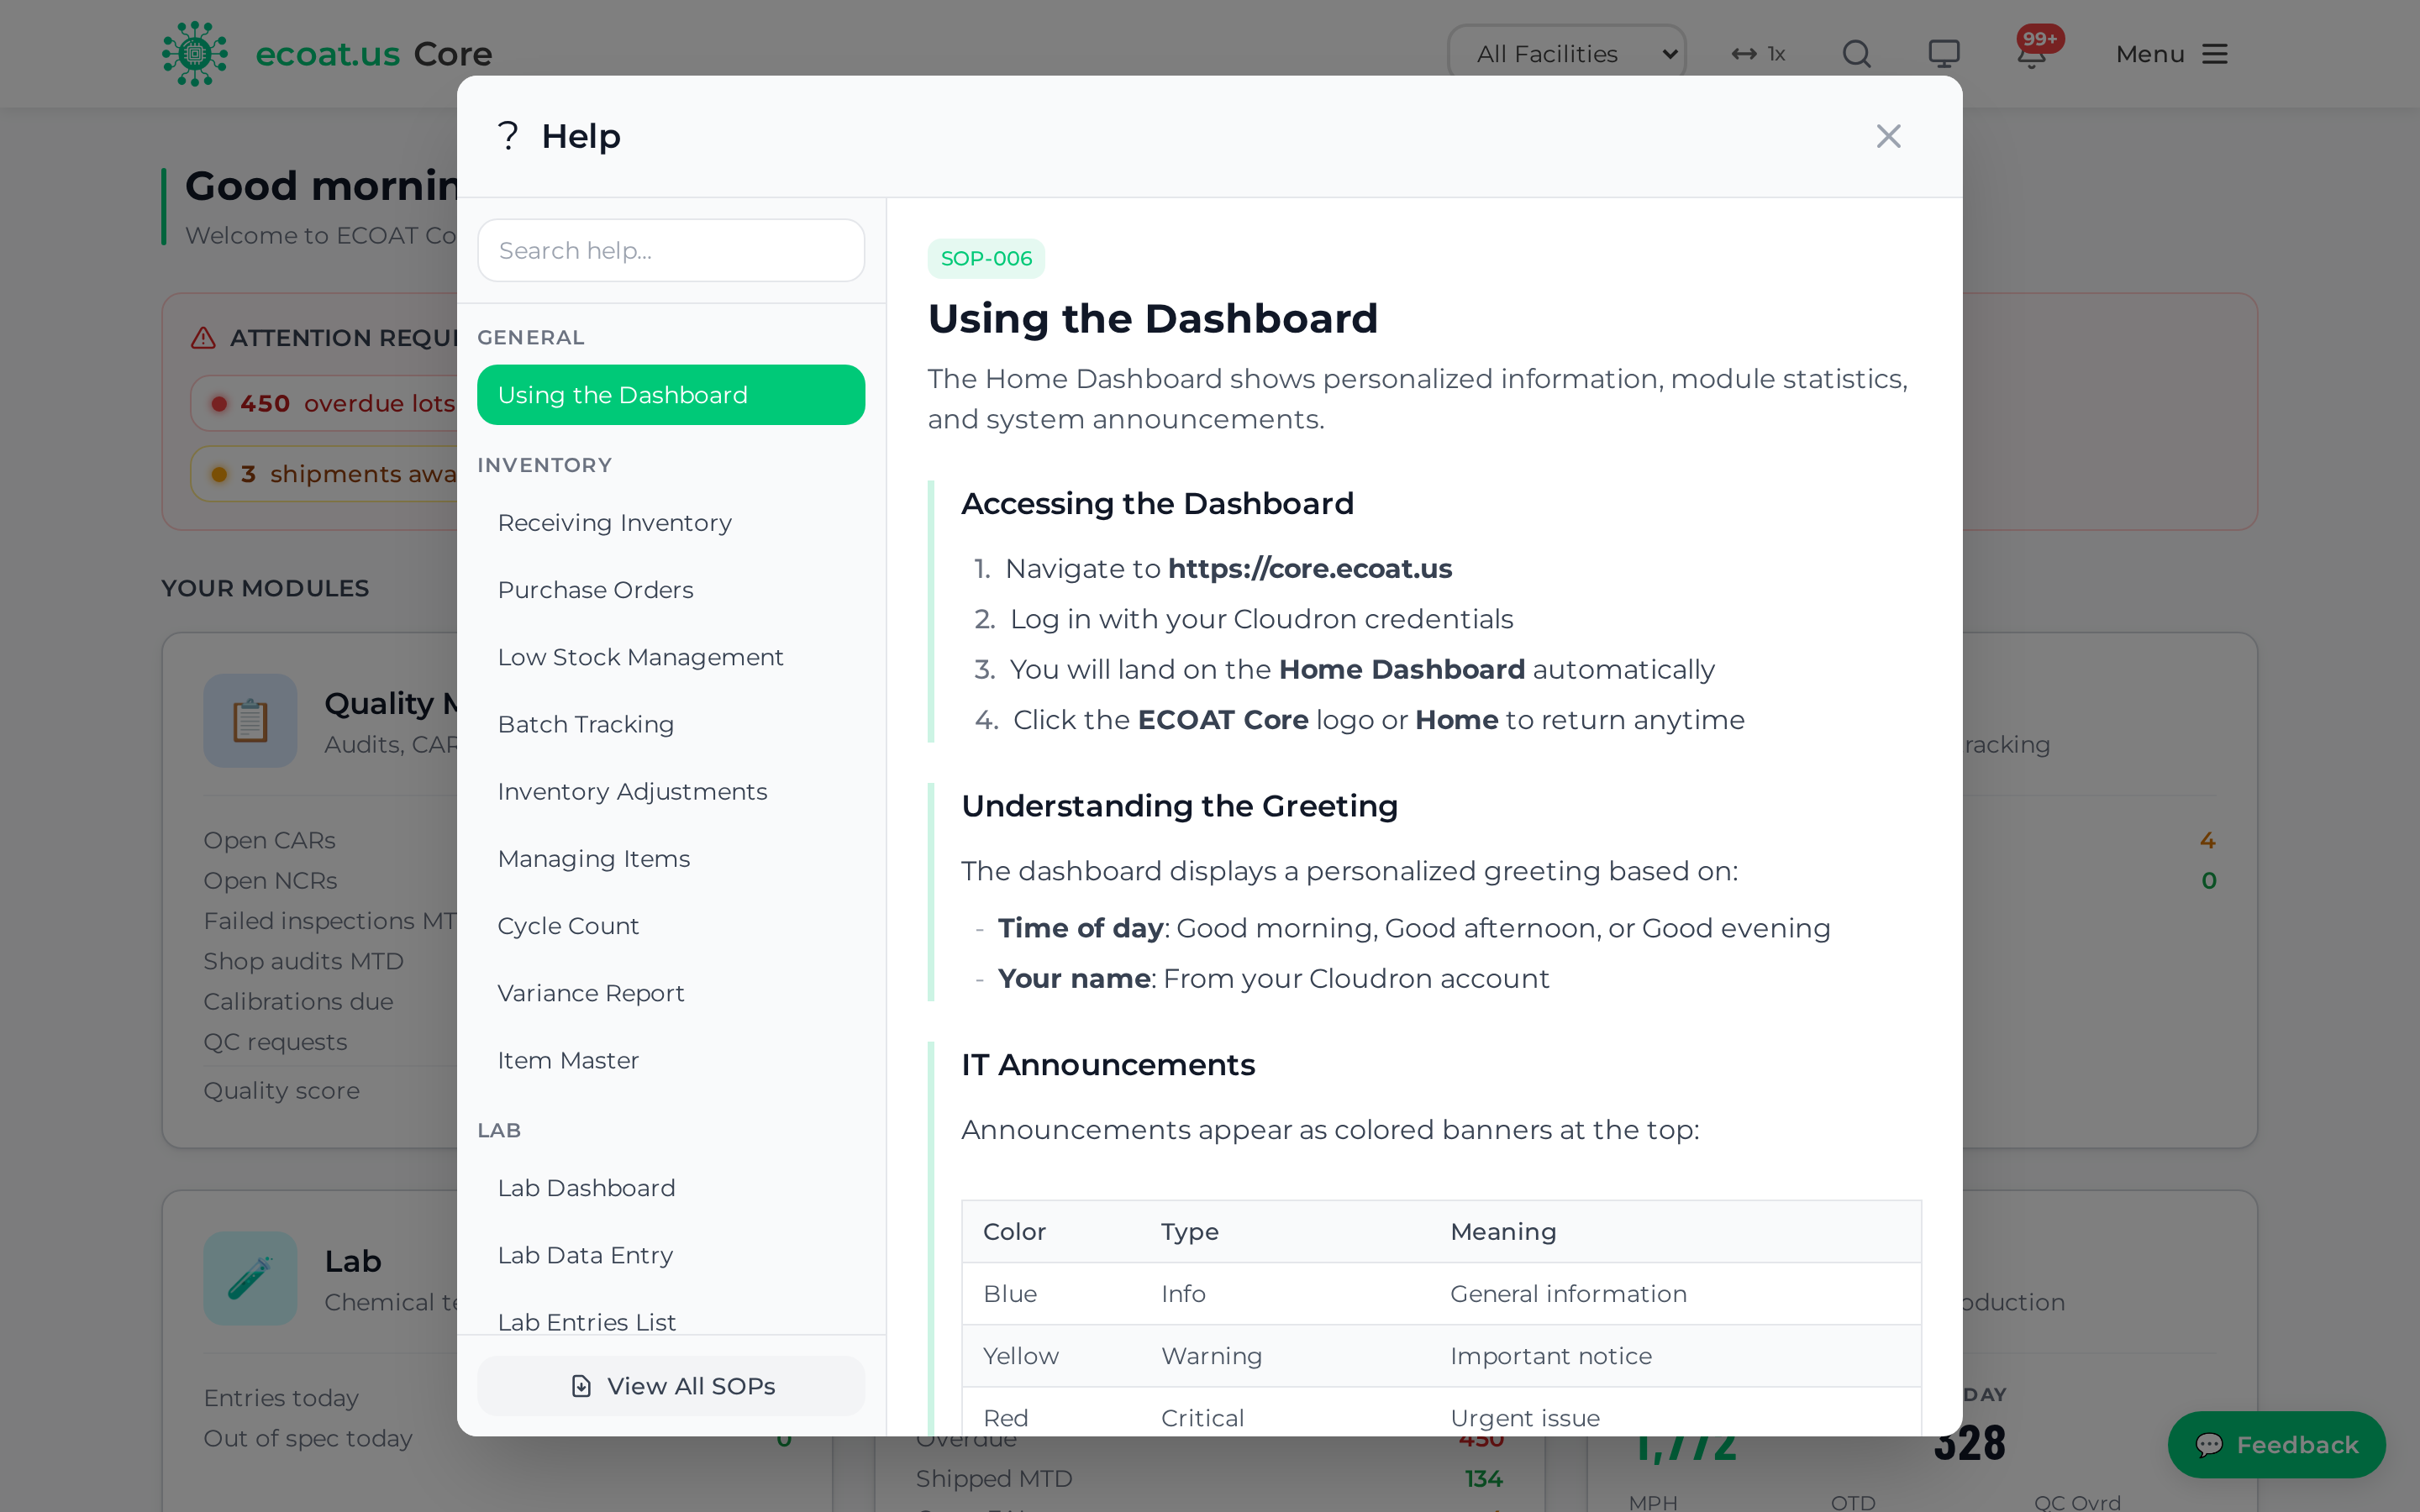
- Press ? on your keyboard (this works everywhere except while you're typing in a box).
- Browse topics in the left sidebar, or type in Search help to filter them.
- Some topics link to the full written SOP — click View All SOPs at the bottom of the sidebar.
Tip: Help opens to the topic that matches the page you're on, so pressing ? while you're stuck usually lands you on the right instructions immediately.
Sending Feedback
The green Feedback button floats in the bottom-right corner of every page. Use it any time you have a question, hit a problem, or have an idea — it's the fastest way to reach the team building Core, and it automatically records which page you were on.
- Click the 💬 Feedback button.
- Pick a category: Question, Issue, Idea, Praise, or Other.
- Type your message. If it's a problem, say what you were trying to do.
- Click Send.
Seeing replies to your feedback
The team reads every submission and often replies. To see your past feedback and any responses, open the Feedback button and click View my feedback & replies →, or go to /feedback/mine.
Tip: For an issue, a single sentence about what you expected versus what happened is worth more than "it's broken." The more specific you are, the faster it gets fixed.
Quality (QMS)
Quality (QMS)
The Quality Management System is where the quality team runs the ISO 9001 program and where the whole plant reports quality issues. It covers audits, calibrations, controlled documents, inspections, corrective actions, customer surveys, and the monthly report — all scoped to the facility you pick in the top bar.
Open it from Menu → QMS. The QMS tab bar groups its screens into five dropdowns — Inspections ▾ (QC Inspection, QC Requests, QC Calendar, FAI, Waiting on Quality), Nonconformance ▾ (NCR, CAR, Shipping Holds), Audits ▾ (ISO Audits, Shop Audits), Records ▾ (Documents, Calibrations, Monthly Report), and Customers ▾ (Customers, Surveys). Dashboard sits on its own at the left and Lots at the right. Paths below are written as QMS → Inspections ▾ → QC Inspection: click the module, open the dropdown, pick the screen.
QMS Dashboard
The dashboard is the quality team's command center. It pulls the whole facility's quality picture onto one screen and gives you one-click buttons to start the most common actions.
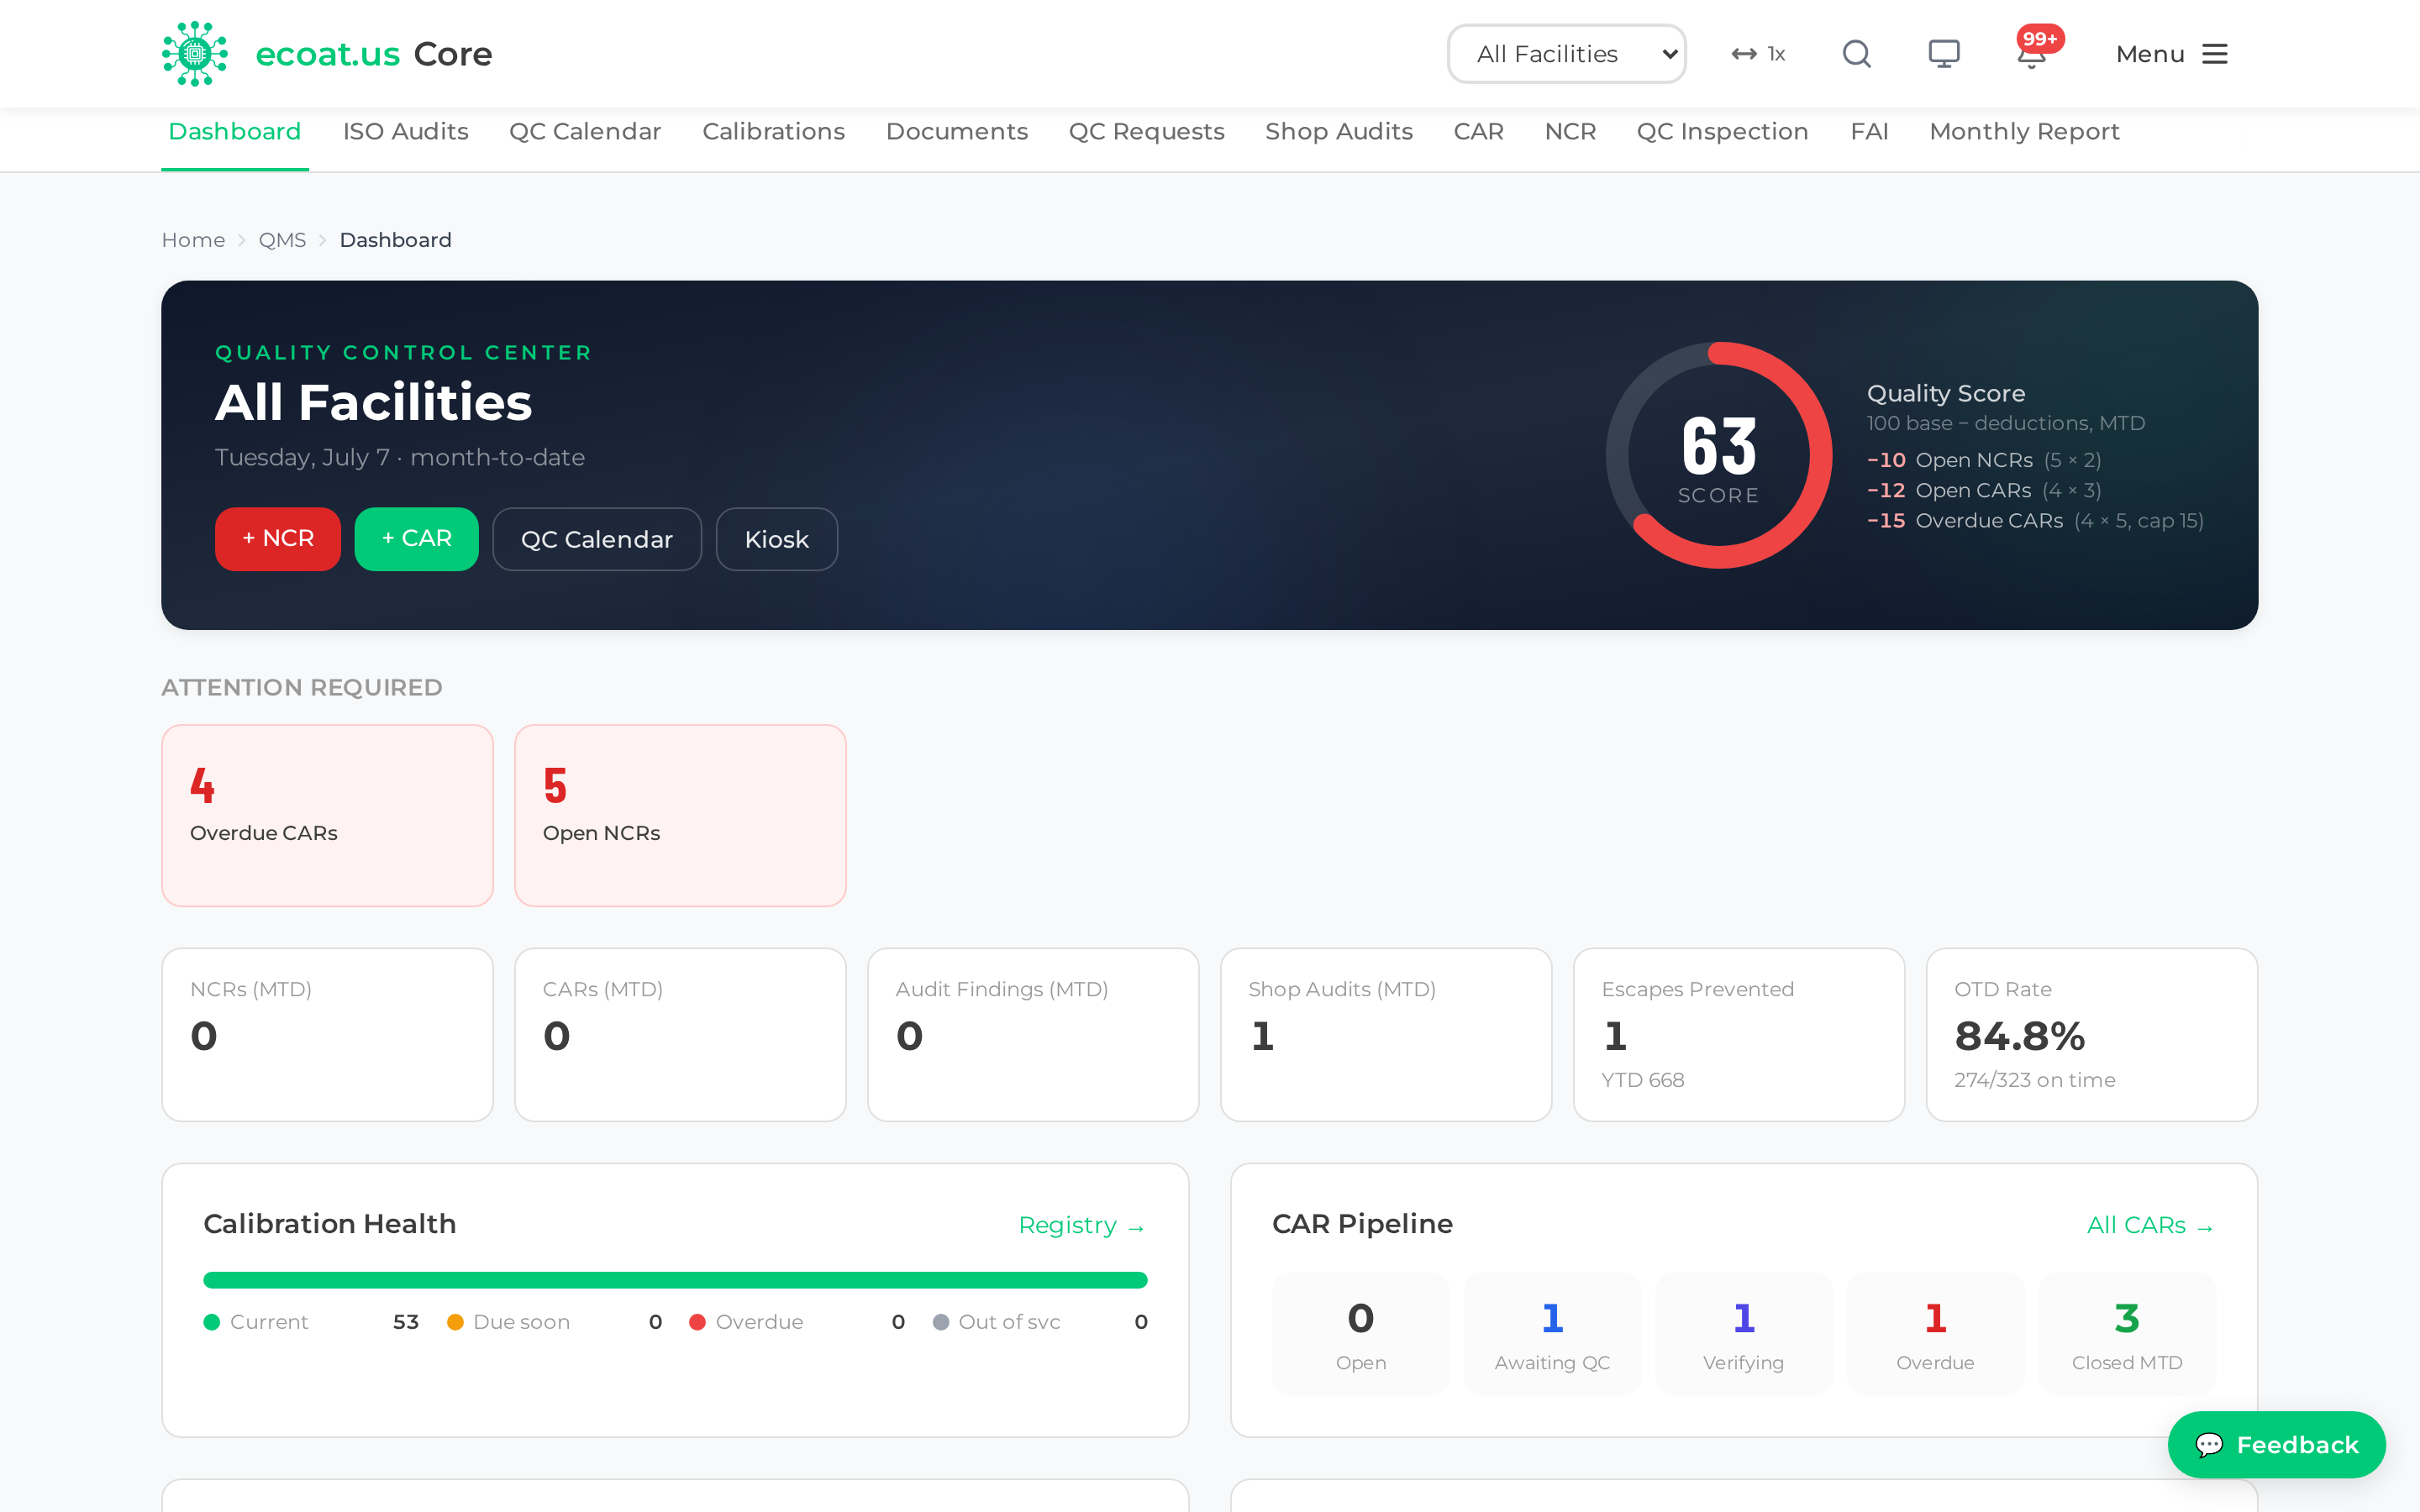
At the top, action buttons let you jump straight into + NCR, + CAR, the QC Calendar, and the Kiosk. Below that you'll find:
- Attention tiles — overdue calibrations, shop audits pending, calibrations due soon.
- Calibration Health — a snapshot of gauge status across the facility.
- CAR Pipeline — open corrective actions by stage.
- QC Requests inbox — the newest items waiting on the quality team.
- NCR Dispositions (MTD) and Film Thickness Averages (MTD).
- Upcoming on the QC Calendar — the next scheduled audit and events.
Tip: Start your day here. The tiles are the same numbers that feed the Home attention rail, but organized by quality topic.
The Kiosk button opens a full-screen, rotating KPI display (Quality KPIs, then DFT Averages) meant for an office TV. It needs a normal login. The two login-less plant-floor boards are covered under Floor boards below.
Floor boards
Two of the quality boards run without a login so they can sit on a plant-floor screen all day. Both use the same device model as the Kanban kiosk: IT opens the page once with ?enroll=<token>&facility=<plant>, and the display remembers itself from then on. Until that happens the page just says the display isn't enrolled yet. Both are read-only — nothing is actioned from a board — and both refresh themselves every 60 seconds.
Add ?tv to the URL for 4K wall sizing, and ?all to show every plant on one screen instead of just this display's.
Quality Alert Board
At /quality/alert-kiosk. A dark control-room board of the plant's live quality position, headed Quality Alert Board.
A coloured bar across the top and a badge give the plant's overall state at a glance — green All clear, amber Watch, or red Action needed — next to the Quality Score. Below it, six tiles, each turning amber or red as its number gets worse:
| Tile | What it counts |
|---|---|
| Open NCRs | Non-conformances not yet closed |
| Overdue CARs | Corrective actions past their due date |
| Open CARs | Corrective actions still in flight |
| Failed Inspections (MTD) | QC inspections that came back Fail this month |
| Audit Findings (MTD) | Findings raised this month |
| Shop Audits Pending | Walk-through sections still not done |
Two panels finish the board: Escapes Prevented (this month and year-to-date) and Open NCRs by Disposition.
QC Kiosk
At /qc/kiosk. The same dark treatment, headed with the plant name and Quality, showing every open QC request as a wide card, oldest first: part number, customer, lot, department, quantity, who asked, and a live timer counting up every second. Three tiles sit in the header — Waiting, Being inspected, and Oldest wait, that last one a running clock on the request that has waited longest.
The timer's colour is the escalation: a QC inspection request turns amber at 30 minutes and red at 60 (IT can tune both per display), while FAI and process requests use the slower 4-hour / 24-hour ladder. The moment an inspector starts the inspection in Core, the card shifts blue and gains a Being inspected chip — so the quality office can see at a glance what's untouched versus already being worked.
Cards clear themselves. A card leaves the board the moment its lot's inspection is completed — pass or fail — or when quality resolves the request by hand on QC Requests. Cancelling an inspection puts the card back to waiting. Nobody has to tick anything off on the floor, which is what makes the board worth trusting.
ISO Audits
ISO Audits are the yearly ISO 9001 certification audits, run from standardized templates. Each facility completes all five audits every year, and each finishes with a legally binding digital signature.
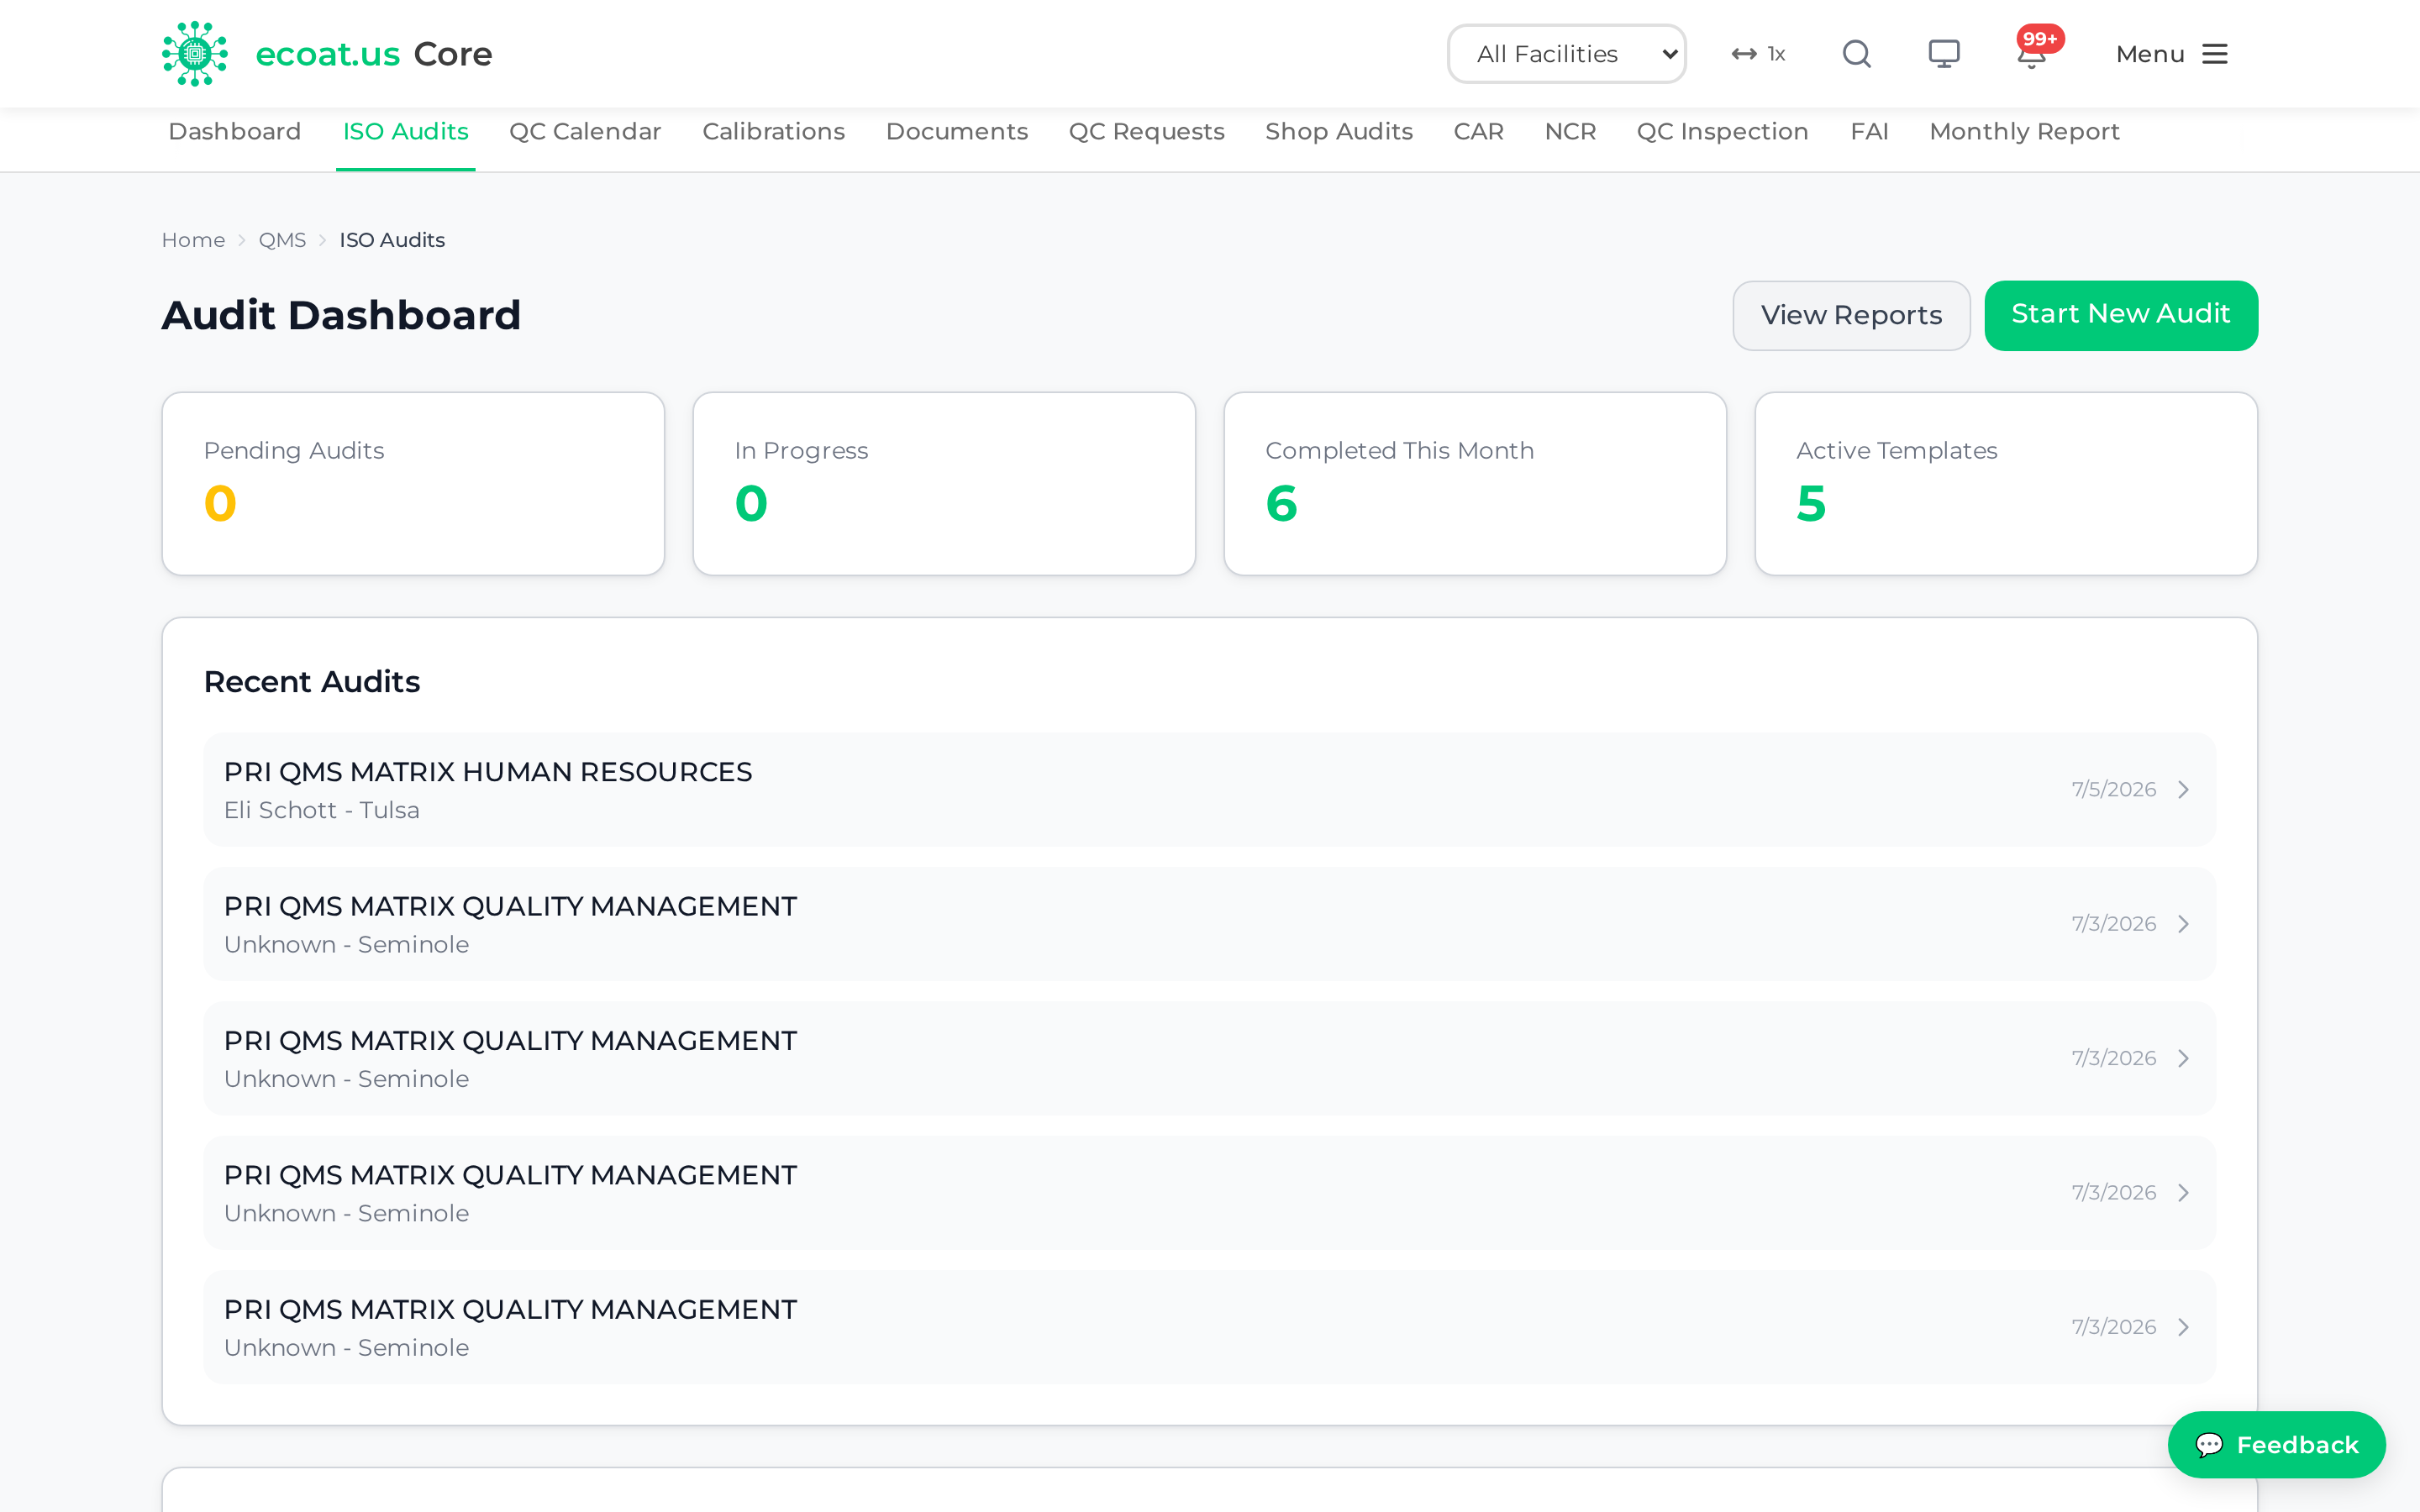
Run an audit
- Go to QMS → Audits ▾ → ISO Audits and click Start New Audit.
- Choose an audit template (Quality Management, Production & Shipping, Human Resources, Purchasing & Receiving, or Sales).
- For each question, read the clause text, then mark Conforming, Non-Conforming, or N/A.
- Add notes explaining your finding, and upload evidence photos or documents where helpful.
- When every question is answered, review the summary and click Sign Audit to finish.
The signature captures your name, email, IP address, and timestamp, and is E-SIGN Act compliant.
Tip: Download any completed audit as a PDF from ISO Audits → Reports, where you can filter by time range, type, and status.
QC Calendar
The QC Calendar is one month-grid view of everything scheduled — planned ISO audits and general quality events together, colour-coded so you can tell them apart at a glance.
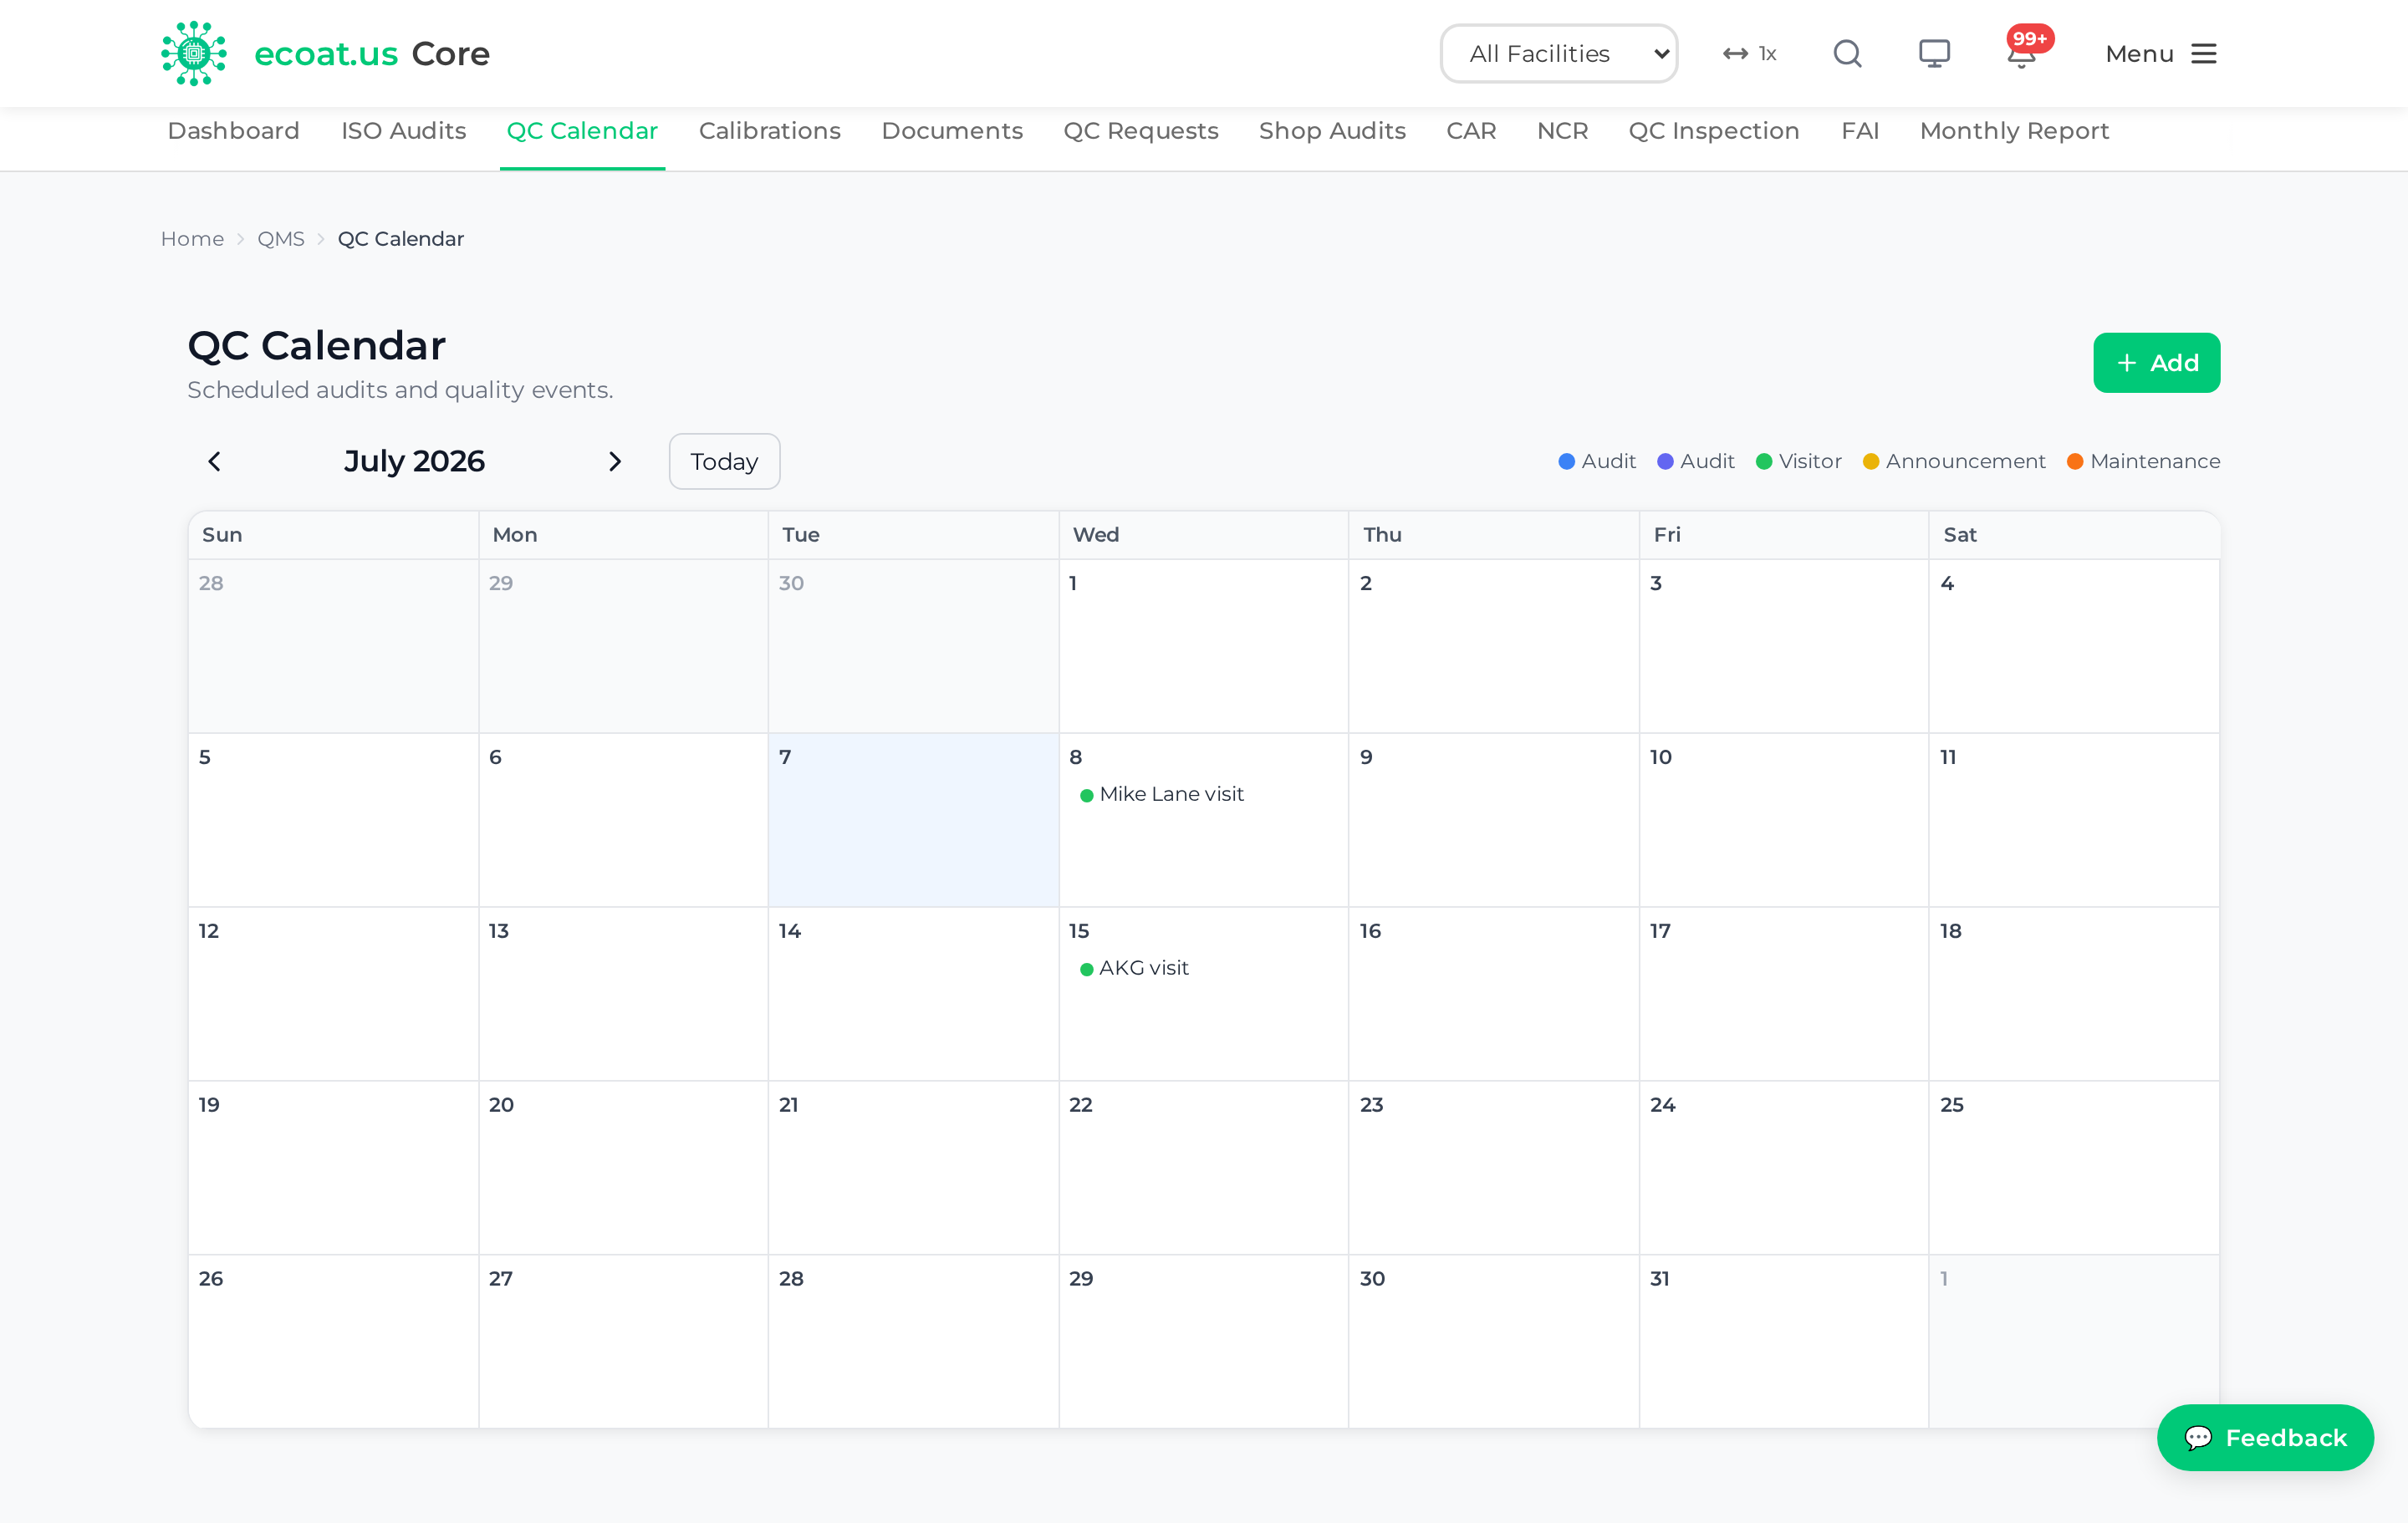
- Go to QMS → Inspections ▾ → QC Calendar.
- Click a day, or the + Add button, to open the chooser.
- Pick Schedule audit (to plan an ISO audit) or Add event (for any other quality event).
- Click an existing chip to open its details.
Permissions: Anyone can view the calendar. Scheduling audits and adding events requires quality write access.
Calibrations
Calibrations is the gauge registry. Every measuring instrument the facility relies on lives here with its calibration due date, and the system colours each one by how close it is to expiring.
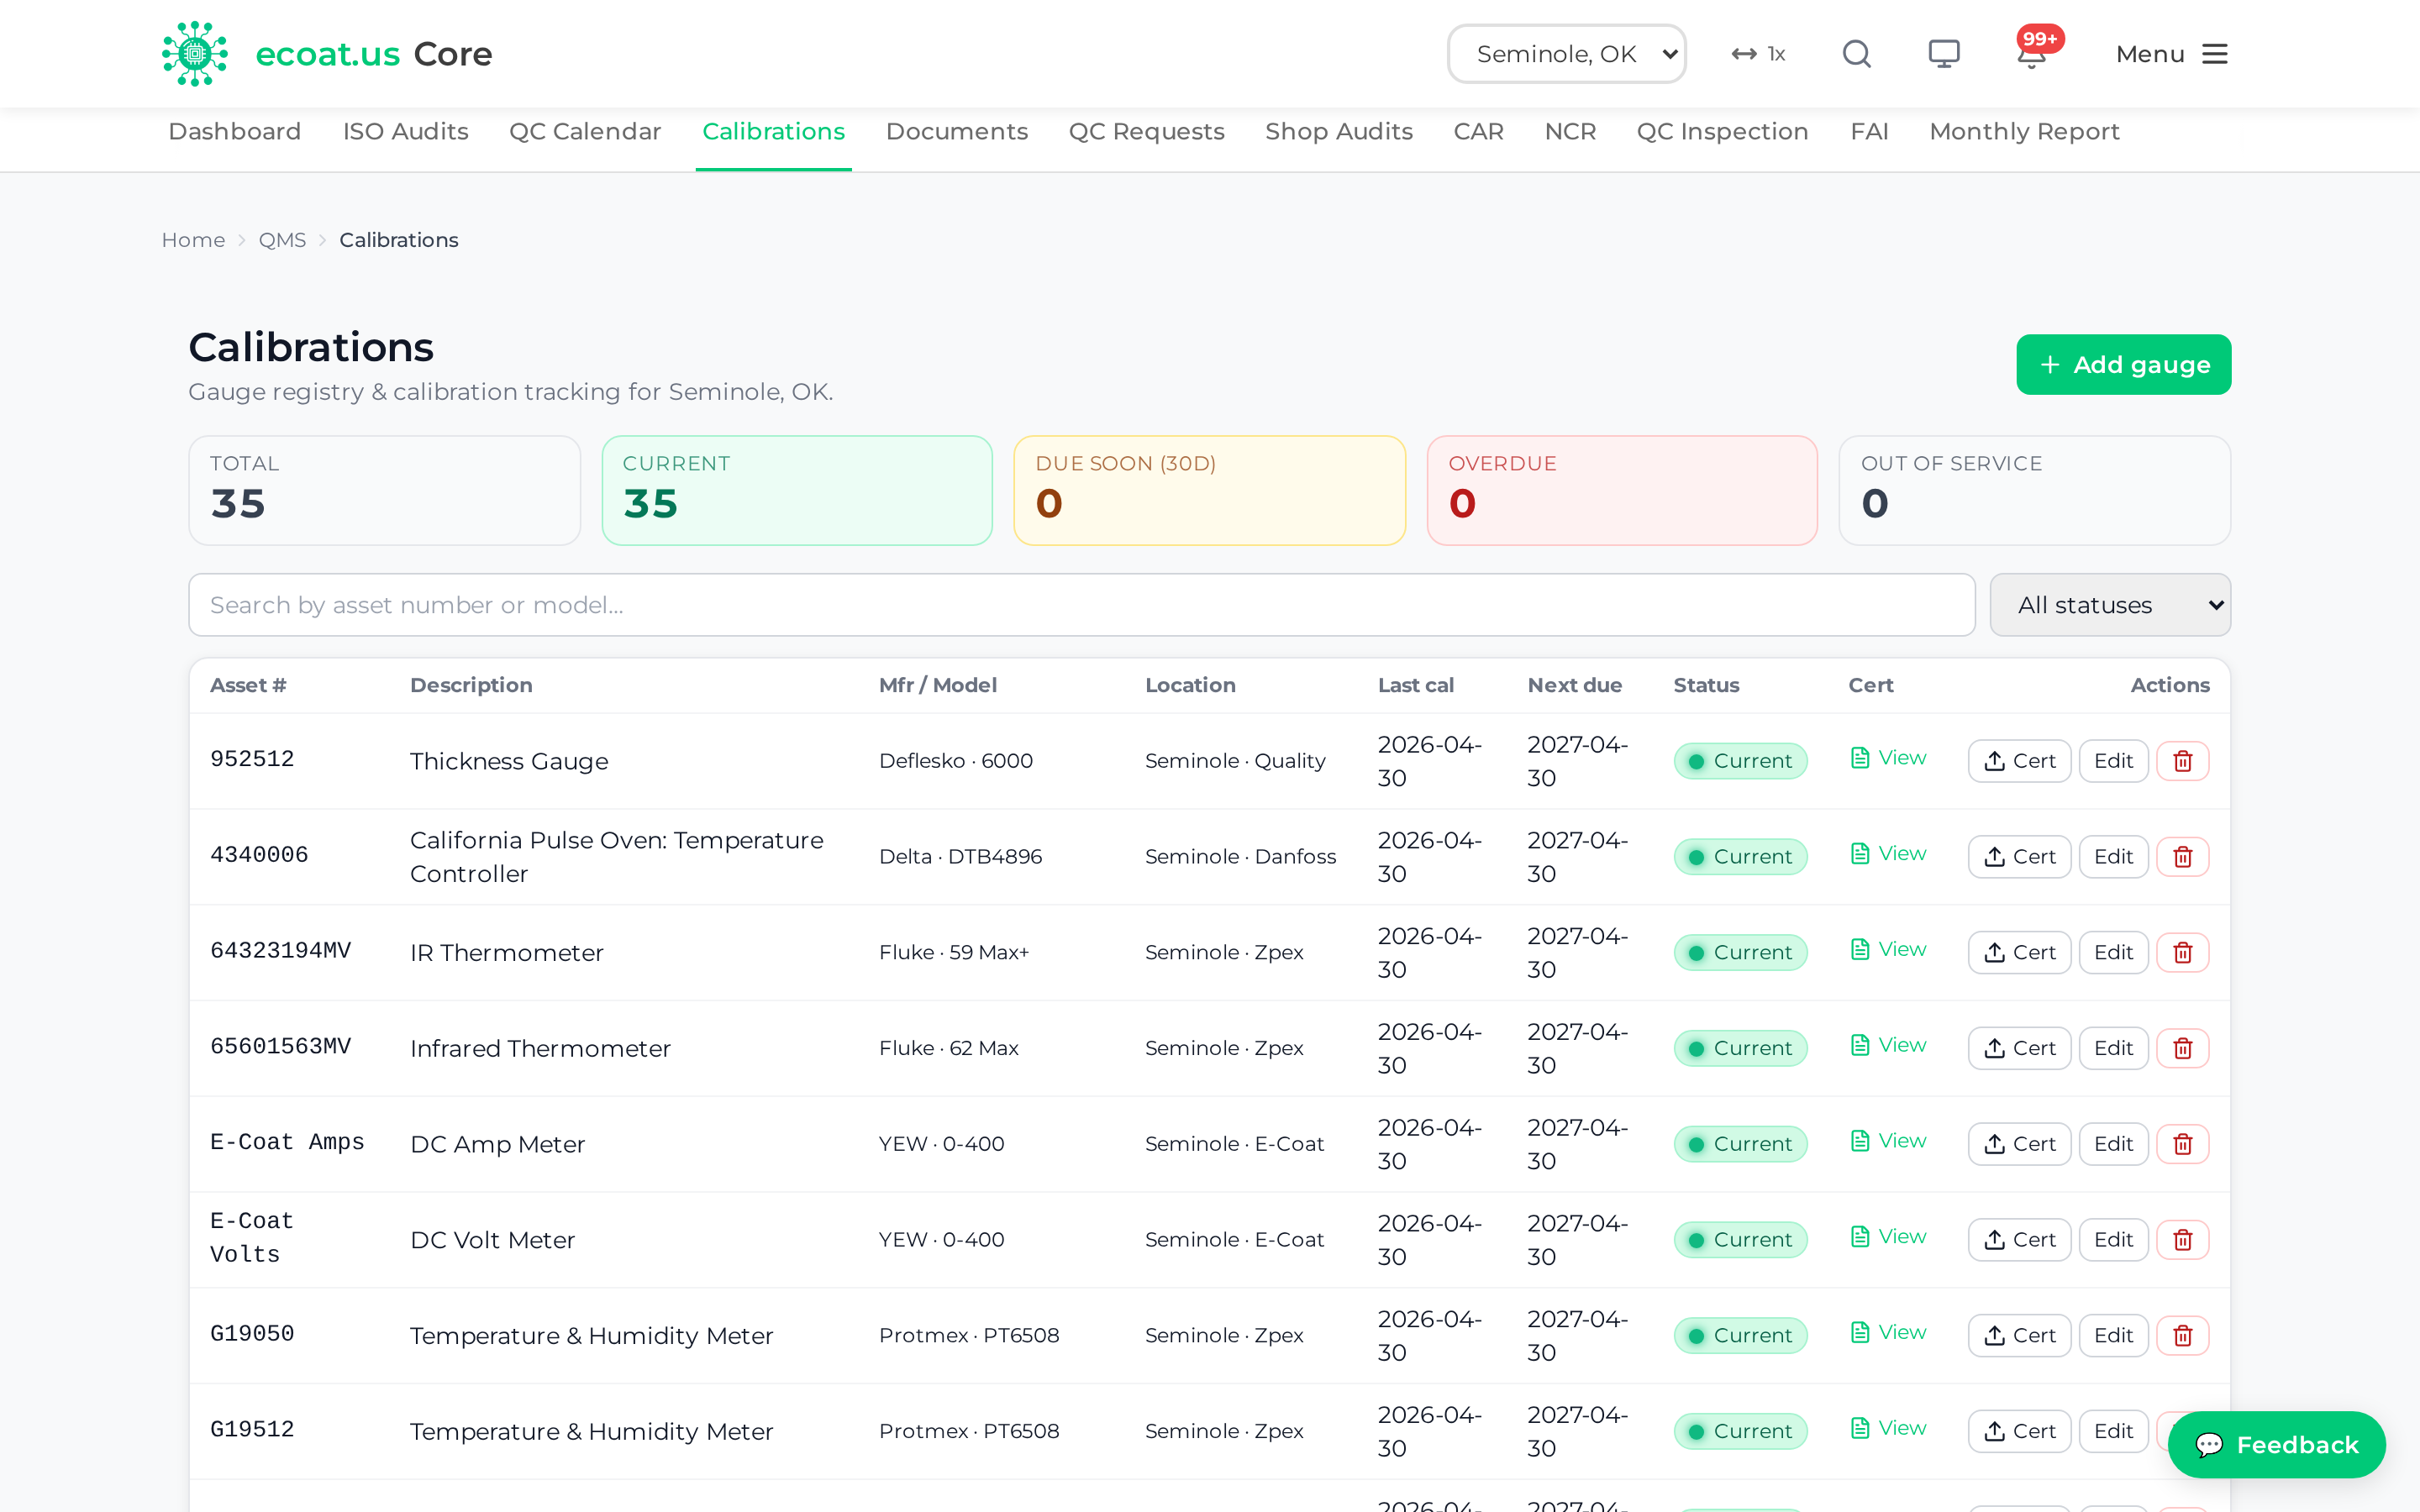
Each gauge shows one of four statuses:
| Status | Meaning |
|---|---|
| Current (green) | In calibration, nothing due |
| Due Soon (amber) | Calibration due within 30 days |
| Overdue (red) | Past its calibration date — do not rely on it |
| Out of Service (grey) | Pulled from use |
Add a gauge or log a calibration
- Go to QMS → Records ▾ → Calibrations.
- Click Add gauge to register a new instrument.
- To record a completed calibration, open the gauge and use Log Calibration — this stamps the new date and moves the status back to Current.
- Filter the list by status (All, Due Soon, Overdue, and so on) or search by name.
Tip: Overdue and due-soon counts feed both this page and the Home attention rail, so nothing quietly slips past its date.
Documents
Controlled Documents is the document control library — SOPs, work instructions, forms, and the like, each with revision history and a review interval. Open it from QMS → Records ▾ → Documents.
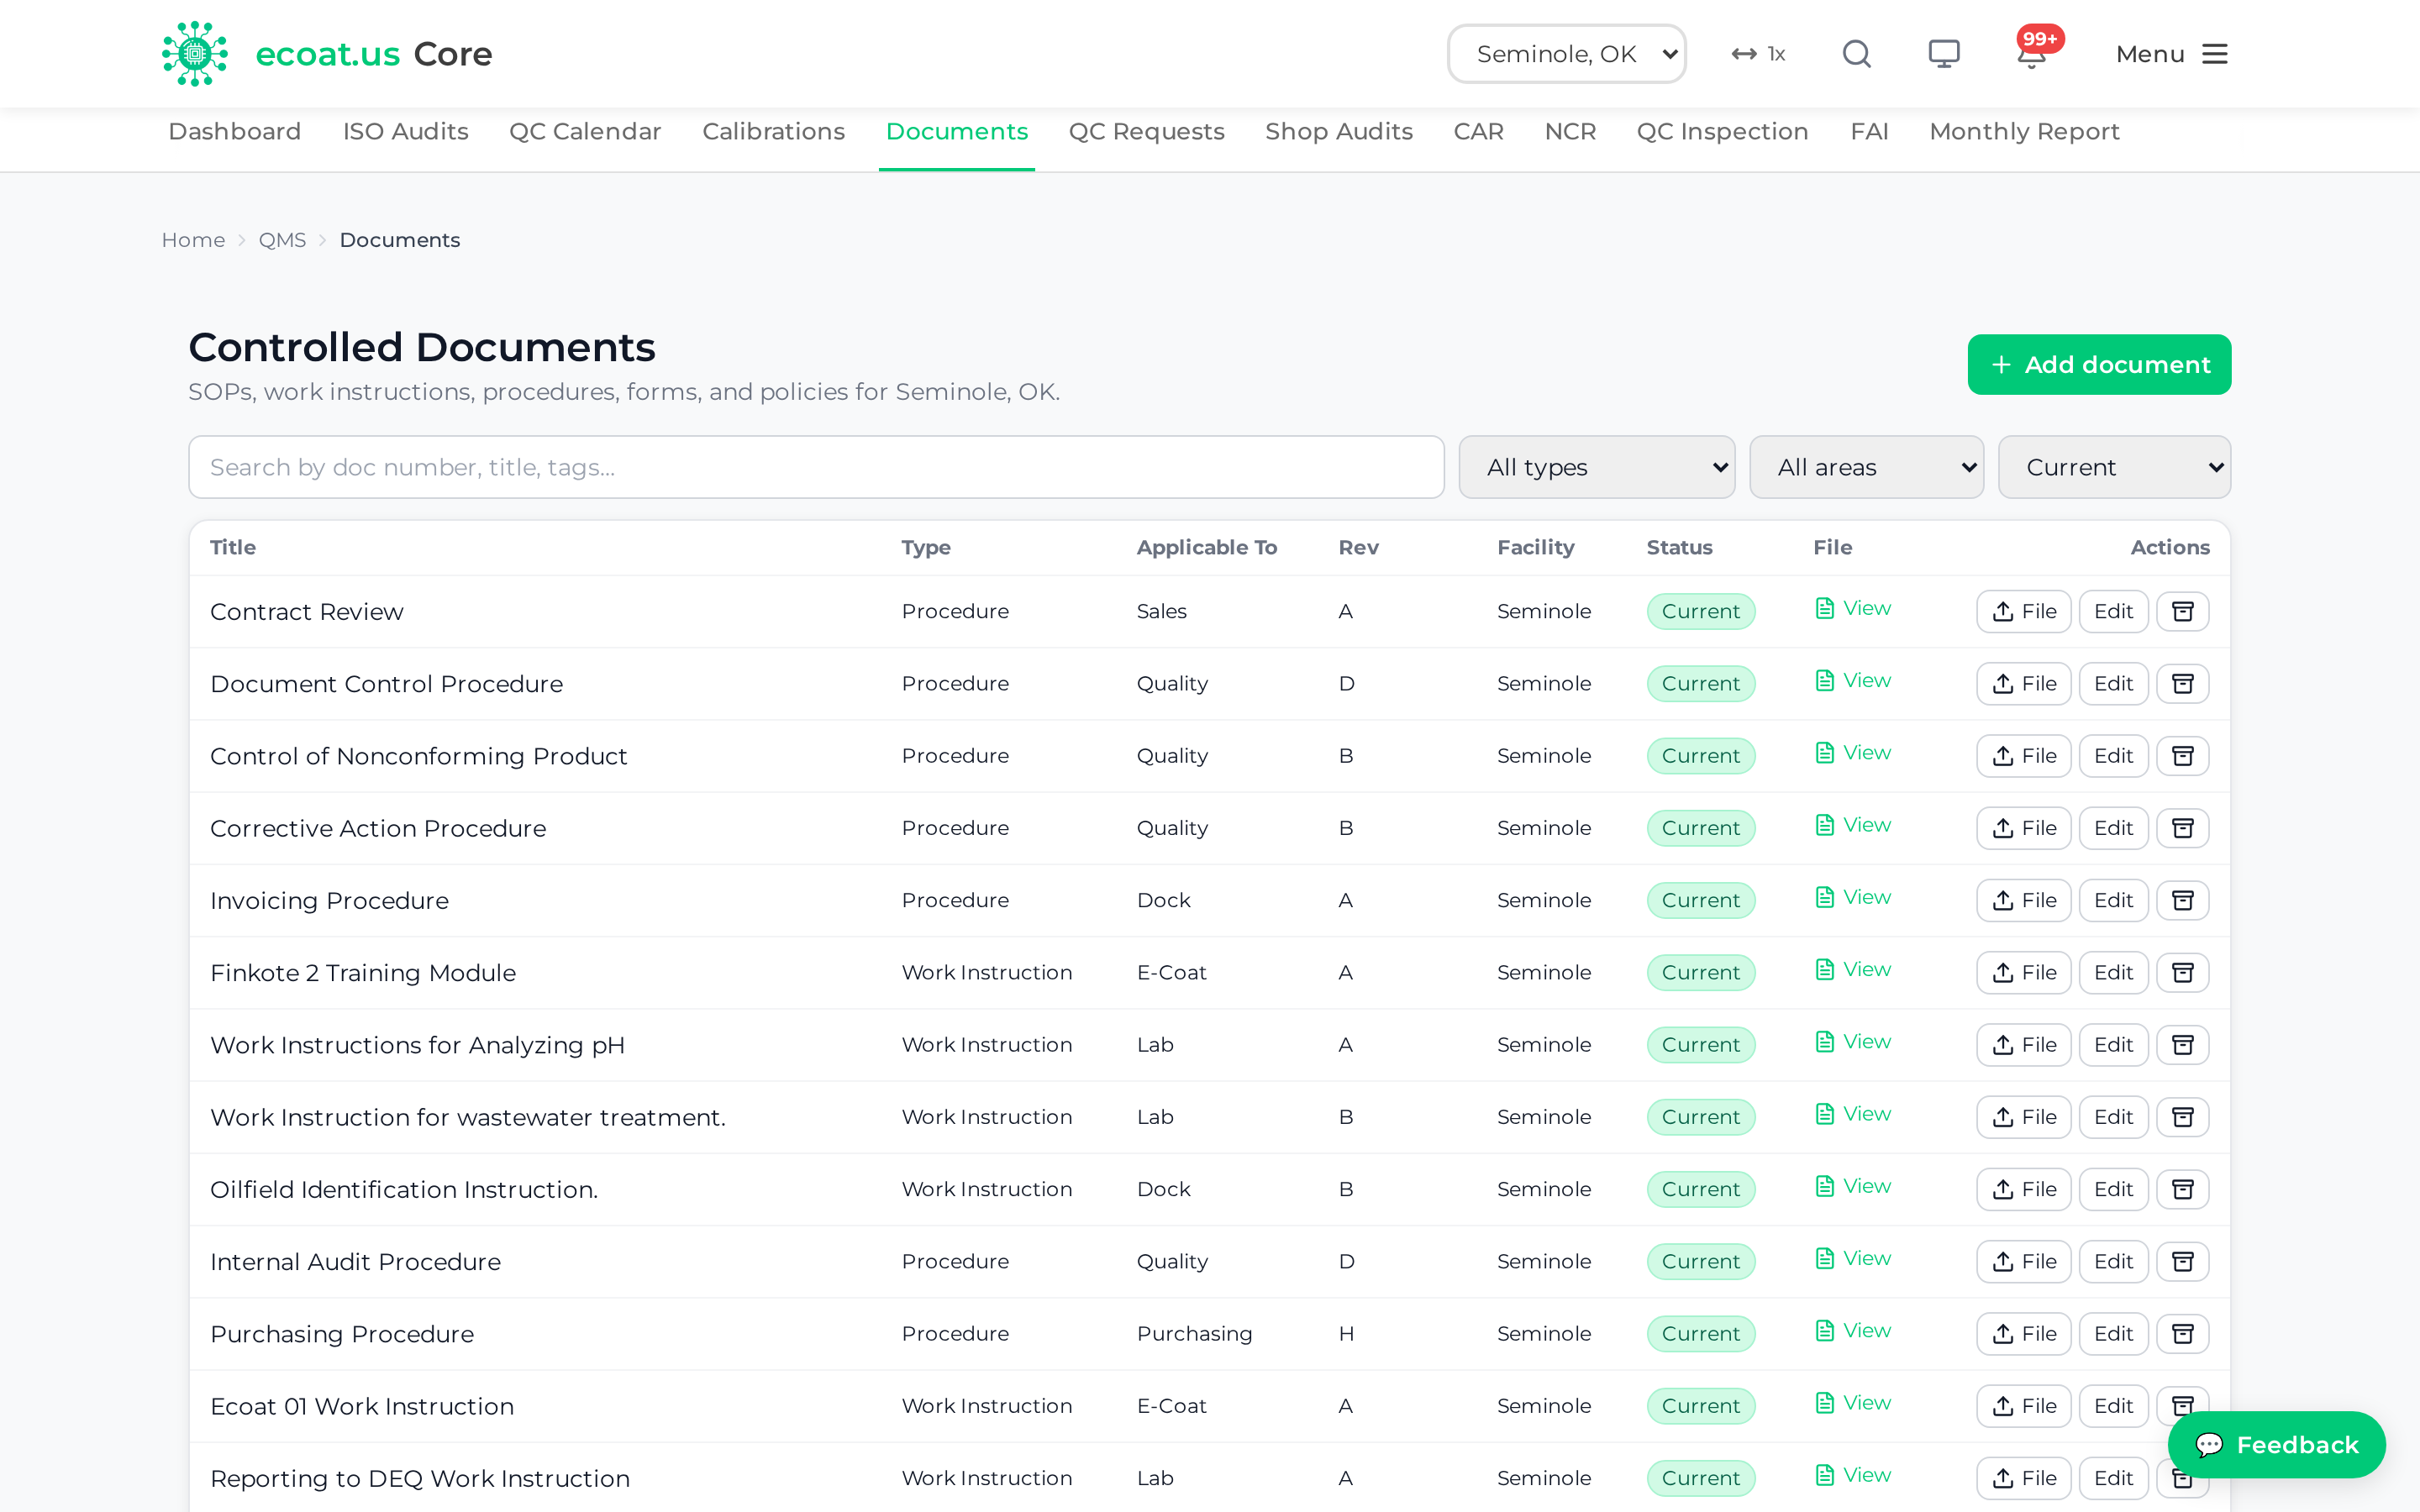
Documents carry a status of Current, Under Review, Superseded, or Archived. Filter the list by type, applicability, status, or search, and click File on a row to open the attached document.
Permissions: Only document control users can add or edit documents. Everyone else — including auditors, general quality staff, and the production and shipping floor — has read-only access so they can always find the current revision at the point of use.
QC Requests
QC Requests is the quality team's inbox — action items and notifications routed from the floor, such as FAI requests and QC inspections that need attention. Open it from QMS → Inspections ▾ → QC Requests.
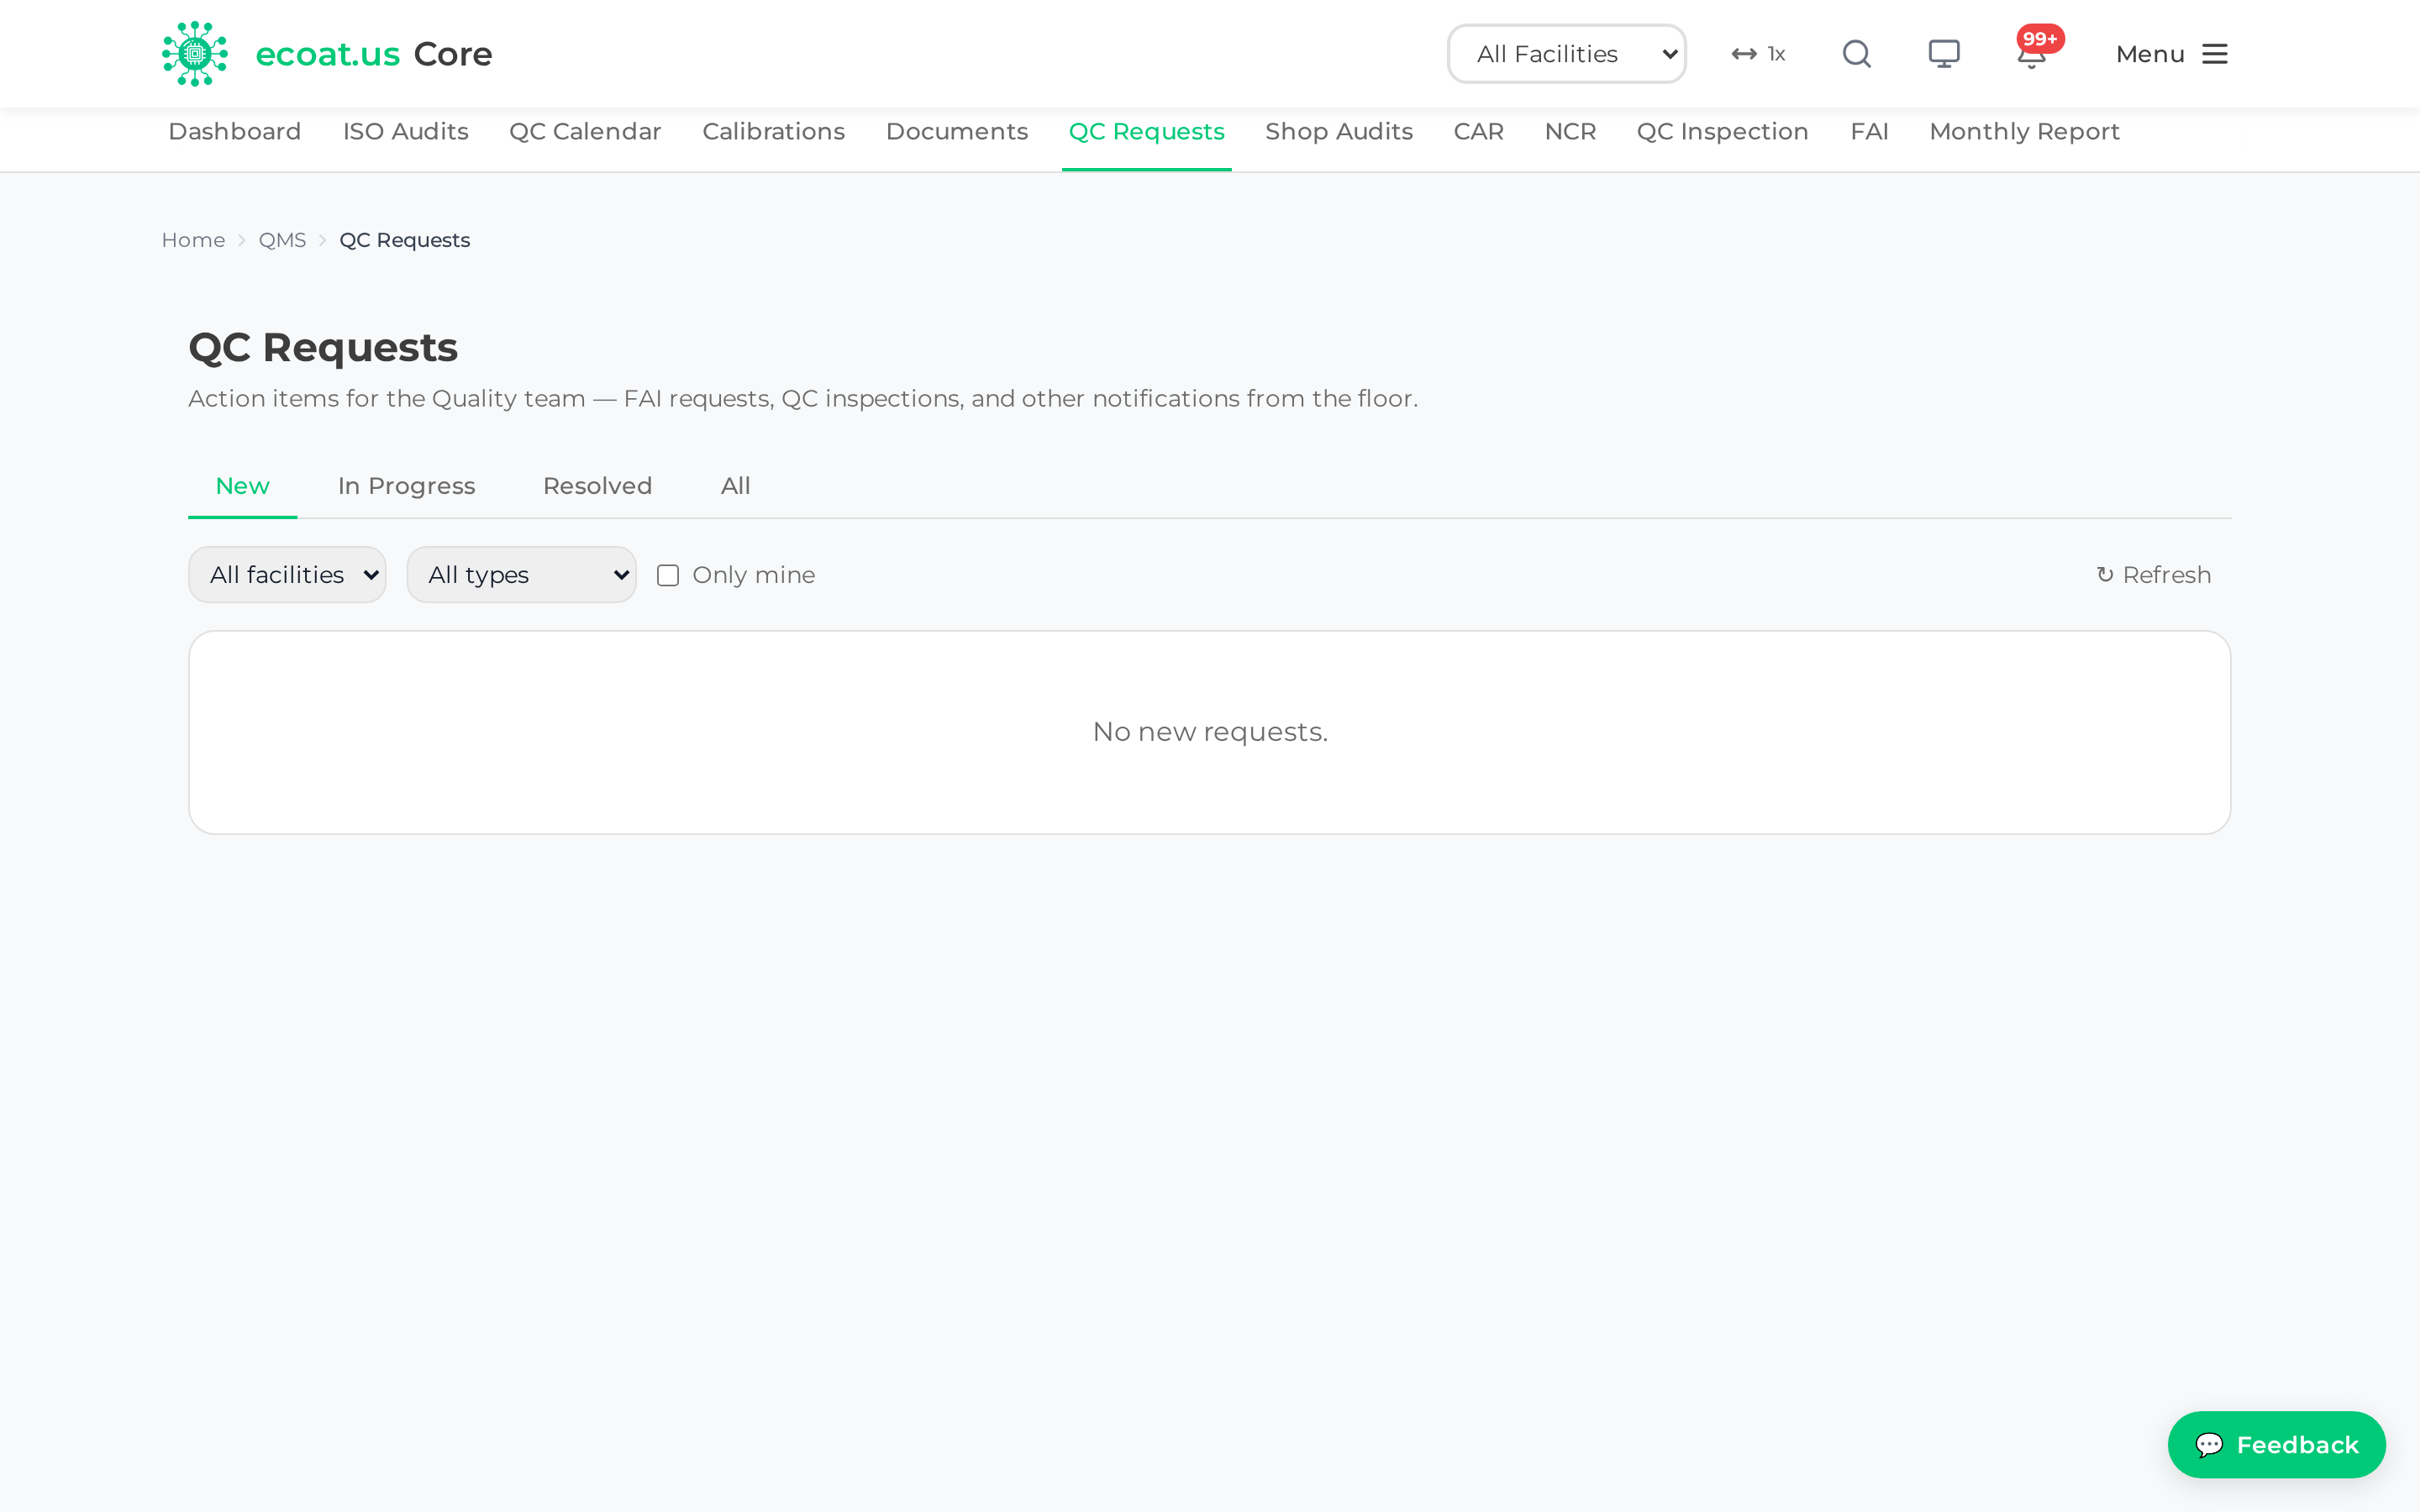
- Requests are grouped into tabs: New, In Progress, and Resolved, with a red count badge on New.
- Each request shows its type (FAI, QC Inspection, or Other), who it came from, and any notes.
- The quality team moves a request along by changing its status as they work it.
Permissions: The quality team sees every request and can change its status. Other users see the requests they submitted.
Waiting on Quality
Waiting on Quality is the same board as the QC kiosk, behind a normal login. Open it from QMS → Inspections ▾ → Waiting on Quality. Use it when you want the card view on your own screen rather than on the wall.
The heading reads Waiting on Quality, and every open FAI, inspection and process request for the selected plant shows as a card sorted longest-waiting first. Filter chips with live counts sit above them: All, FAI, Inspection, Process. Clicking a card opens that request on the QC Requests page. When there is nothing open you get a large All clear.
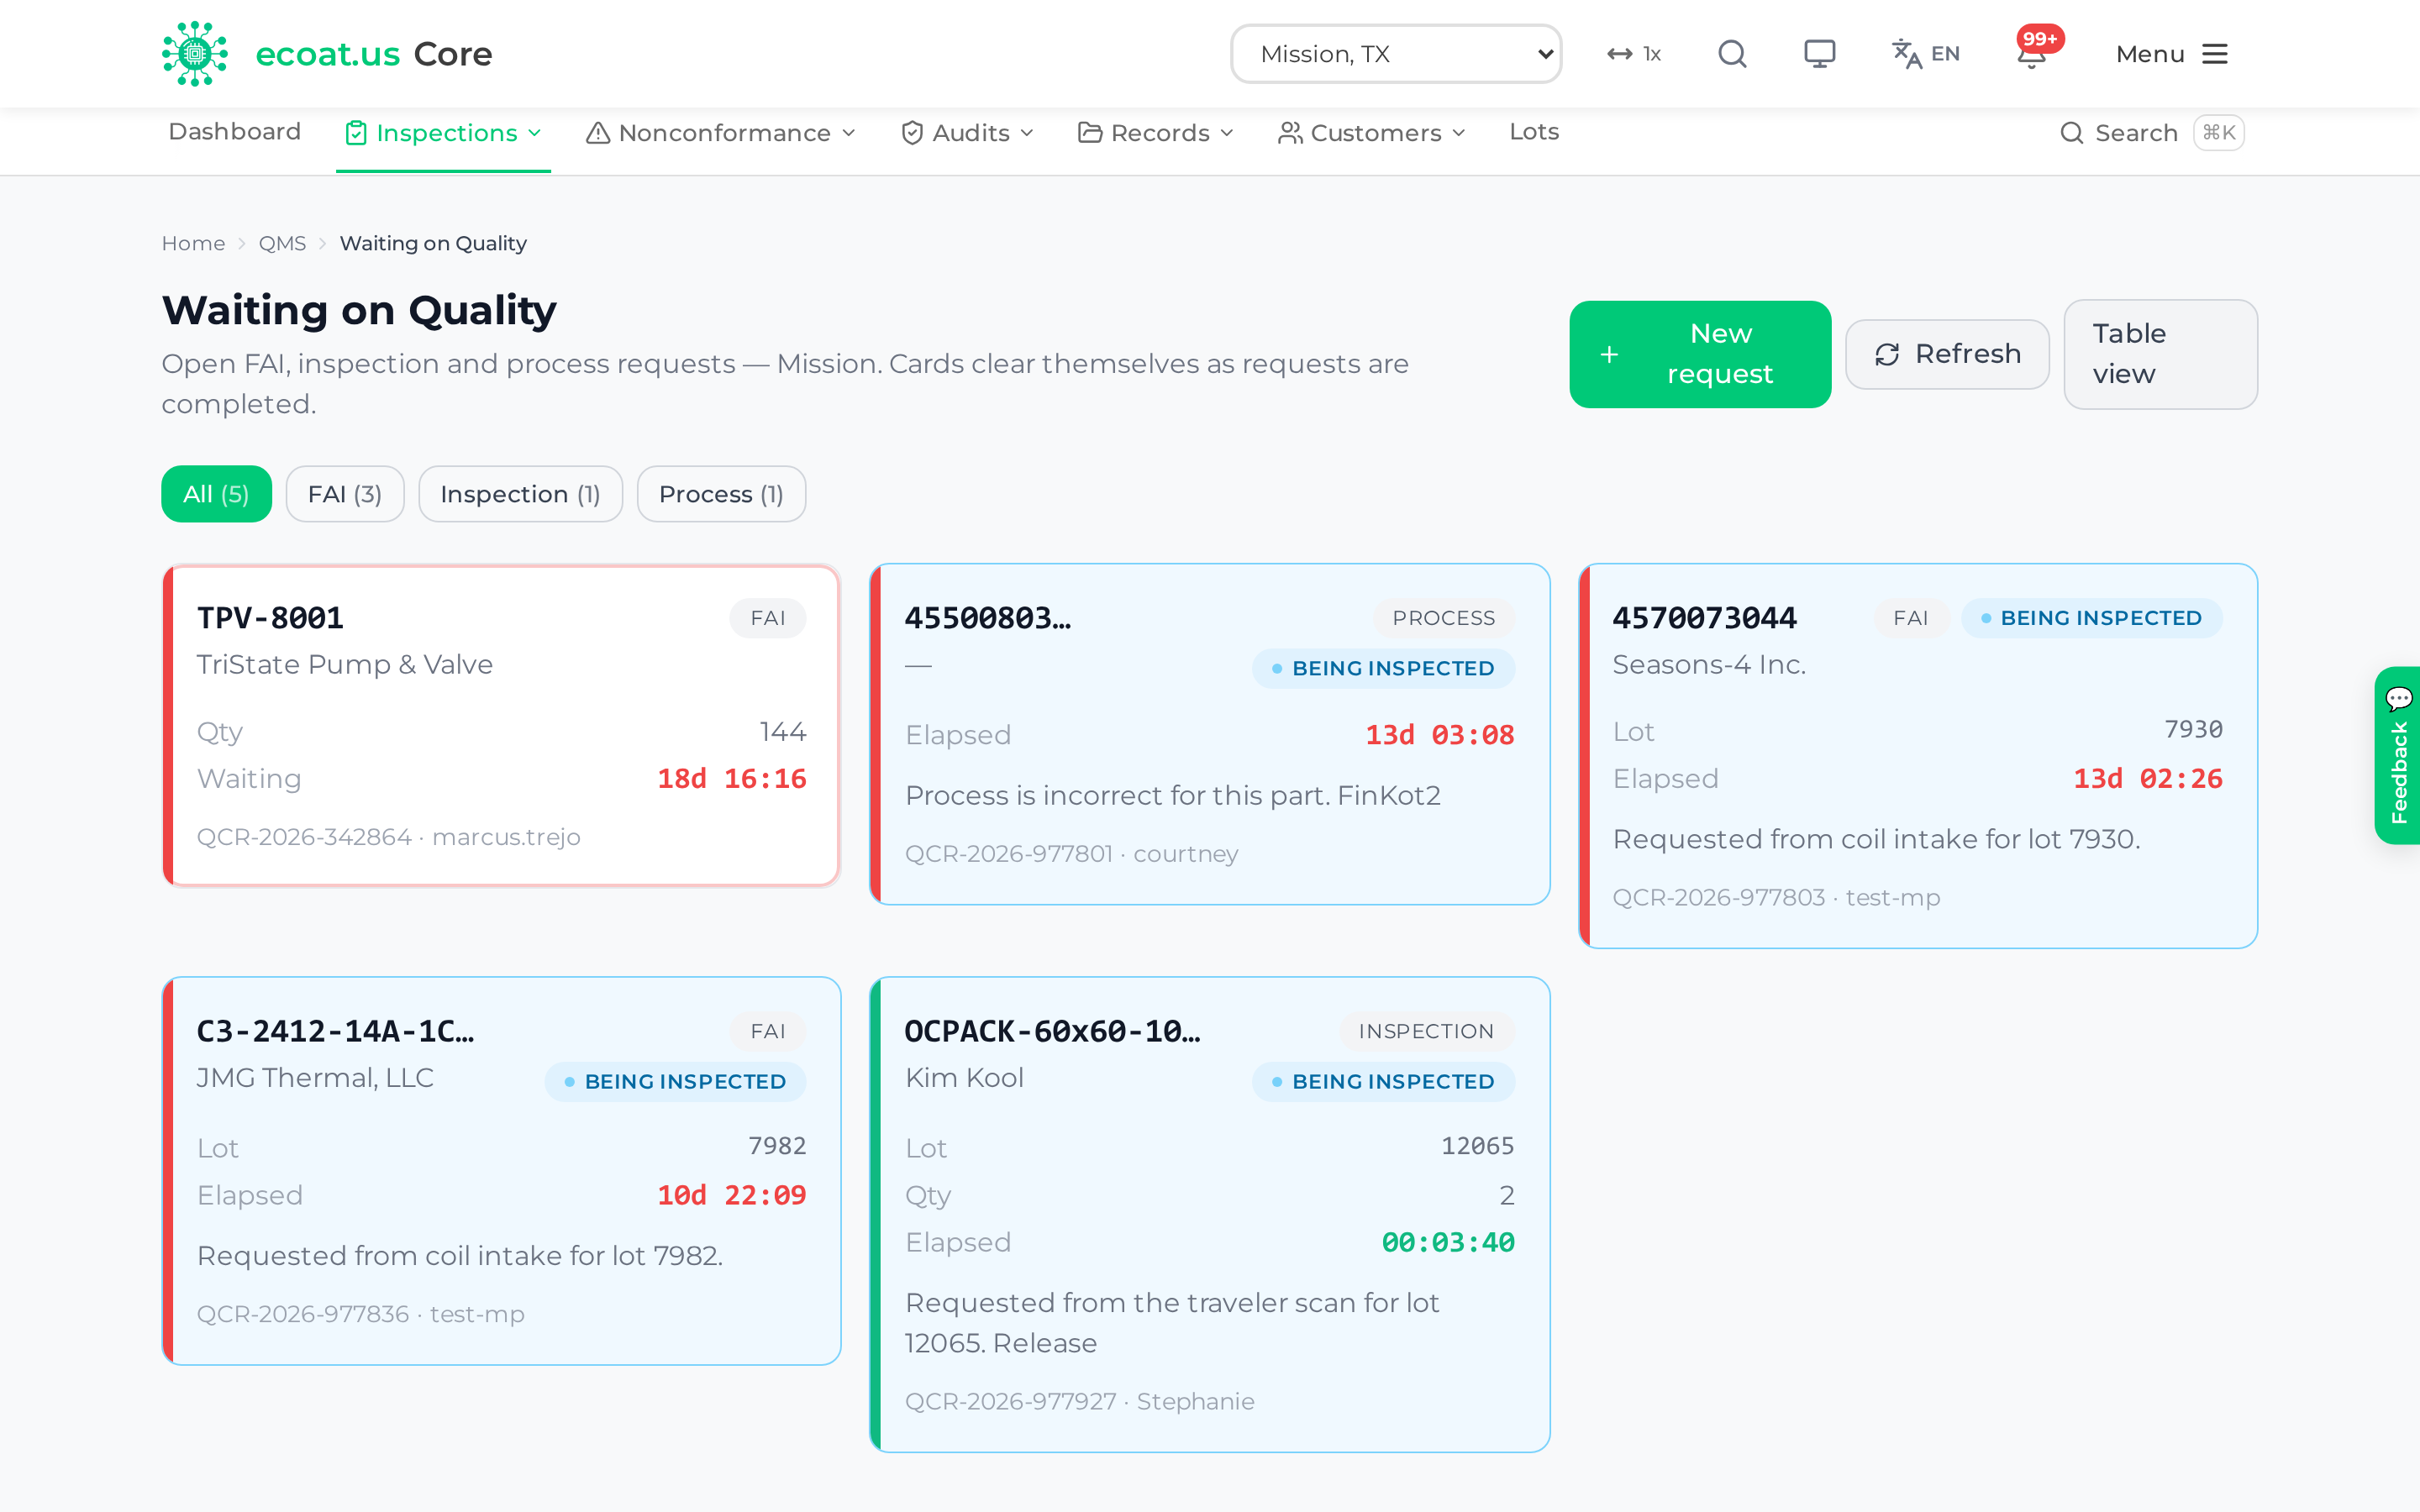
Cards behave exactly like the kiosk's: each carries a live timer (amber at 30 minutes and red at an hour for inspection requests; 4 and 24 hours for the rest), turns blue with a Being inspected chip while an inspector works it, and clears itself when the inspection is completed. Requests raised from a traveler scan land here too, under the name the person typed. A request with no lot attached shows Manual close instead — nothing can clear it automatically, so quality closes it by hand from QC Requests.
Three buttons sit in the header:
- New request — opens Ask quality for something. Pick a type (FAI, Inspection, Process correction, or Other), give the facility and part number (both required), and add a customer and notes if you have them. Raising a request for a part that already has one open just returns the existing request rather than filing a duplicate.
- Refresh — the board also refreshes itself every 60 seconds.
- Table view — switches to the QC Requests list.
Shop Audits
Shop Audits are the recurring daily and weekly walk-throughs of the shop floor — quick GO / NO GO checks that keep operations honest between the big ISO audits.
Complete a section
- Go to QMS → Audits ▾ → Shop Audits and pick a section that's due (e.g. "Zpex", "Ecoat").
- For each question, tap GO (green) if it's compliant or NO GO (red) if it isn't.
- Add notes for every NO GO to explain the issue and what needs to happen.
- Add section observations and upload evidence photos as needed.
- Click Submit Section.
You can reopen a completed section to make changes — your previous answers pre-load, and saving updates the existing record rather than creating a duplicate. The Reports tab summarizes total, completed, incomplete, and overdue audits, with PDF download.
Tip: Always write a note on a NO GO. A bare red mark tells the next person nothing; a one-line note tells them exactly what to fix.
CAR — Corrective Action Requests
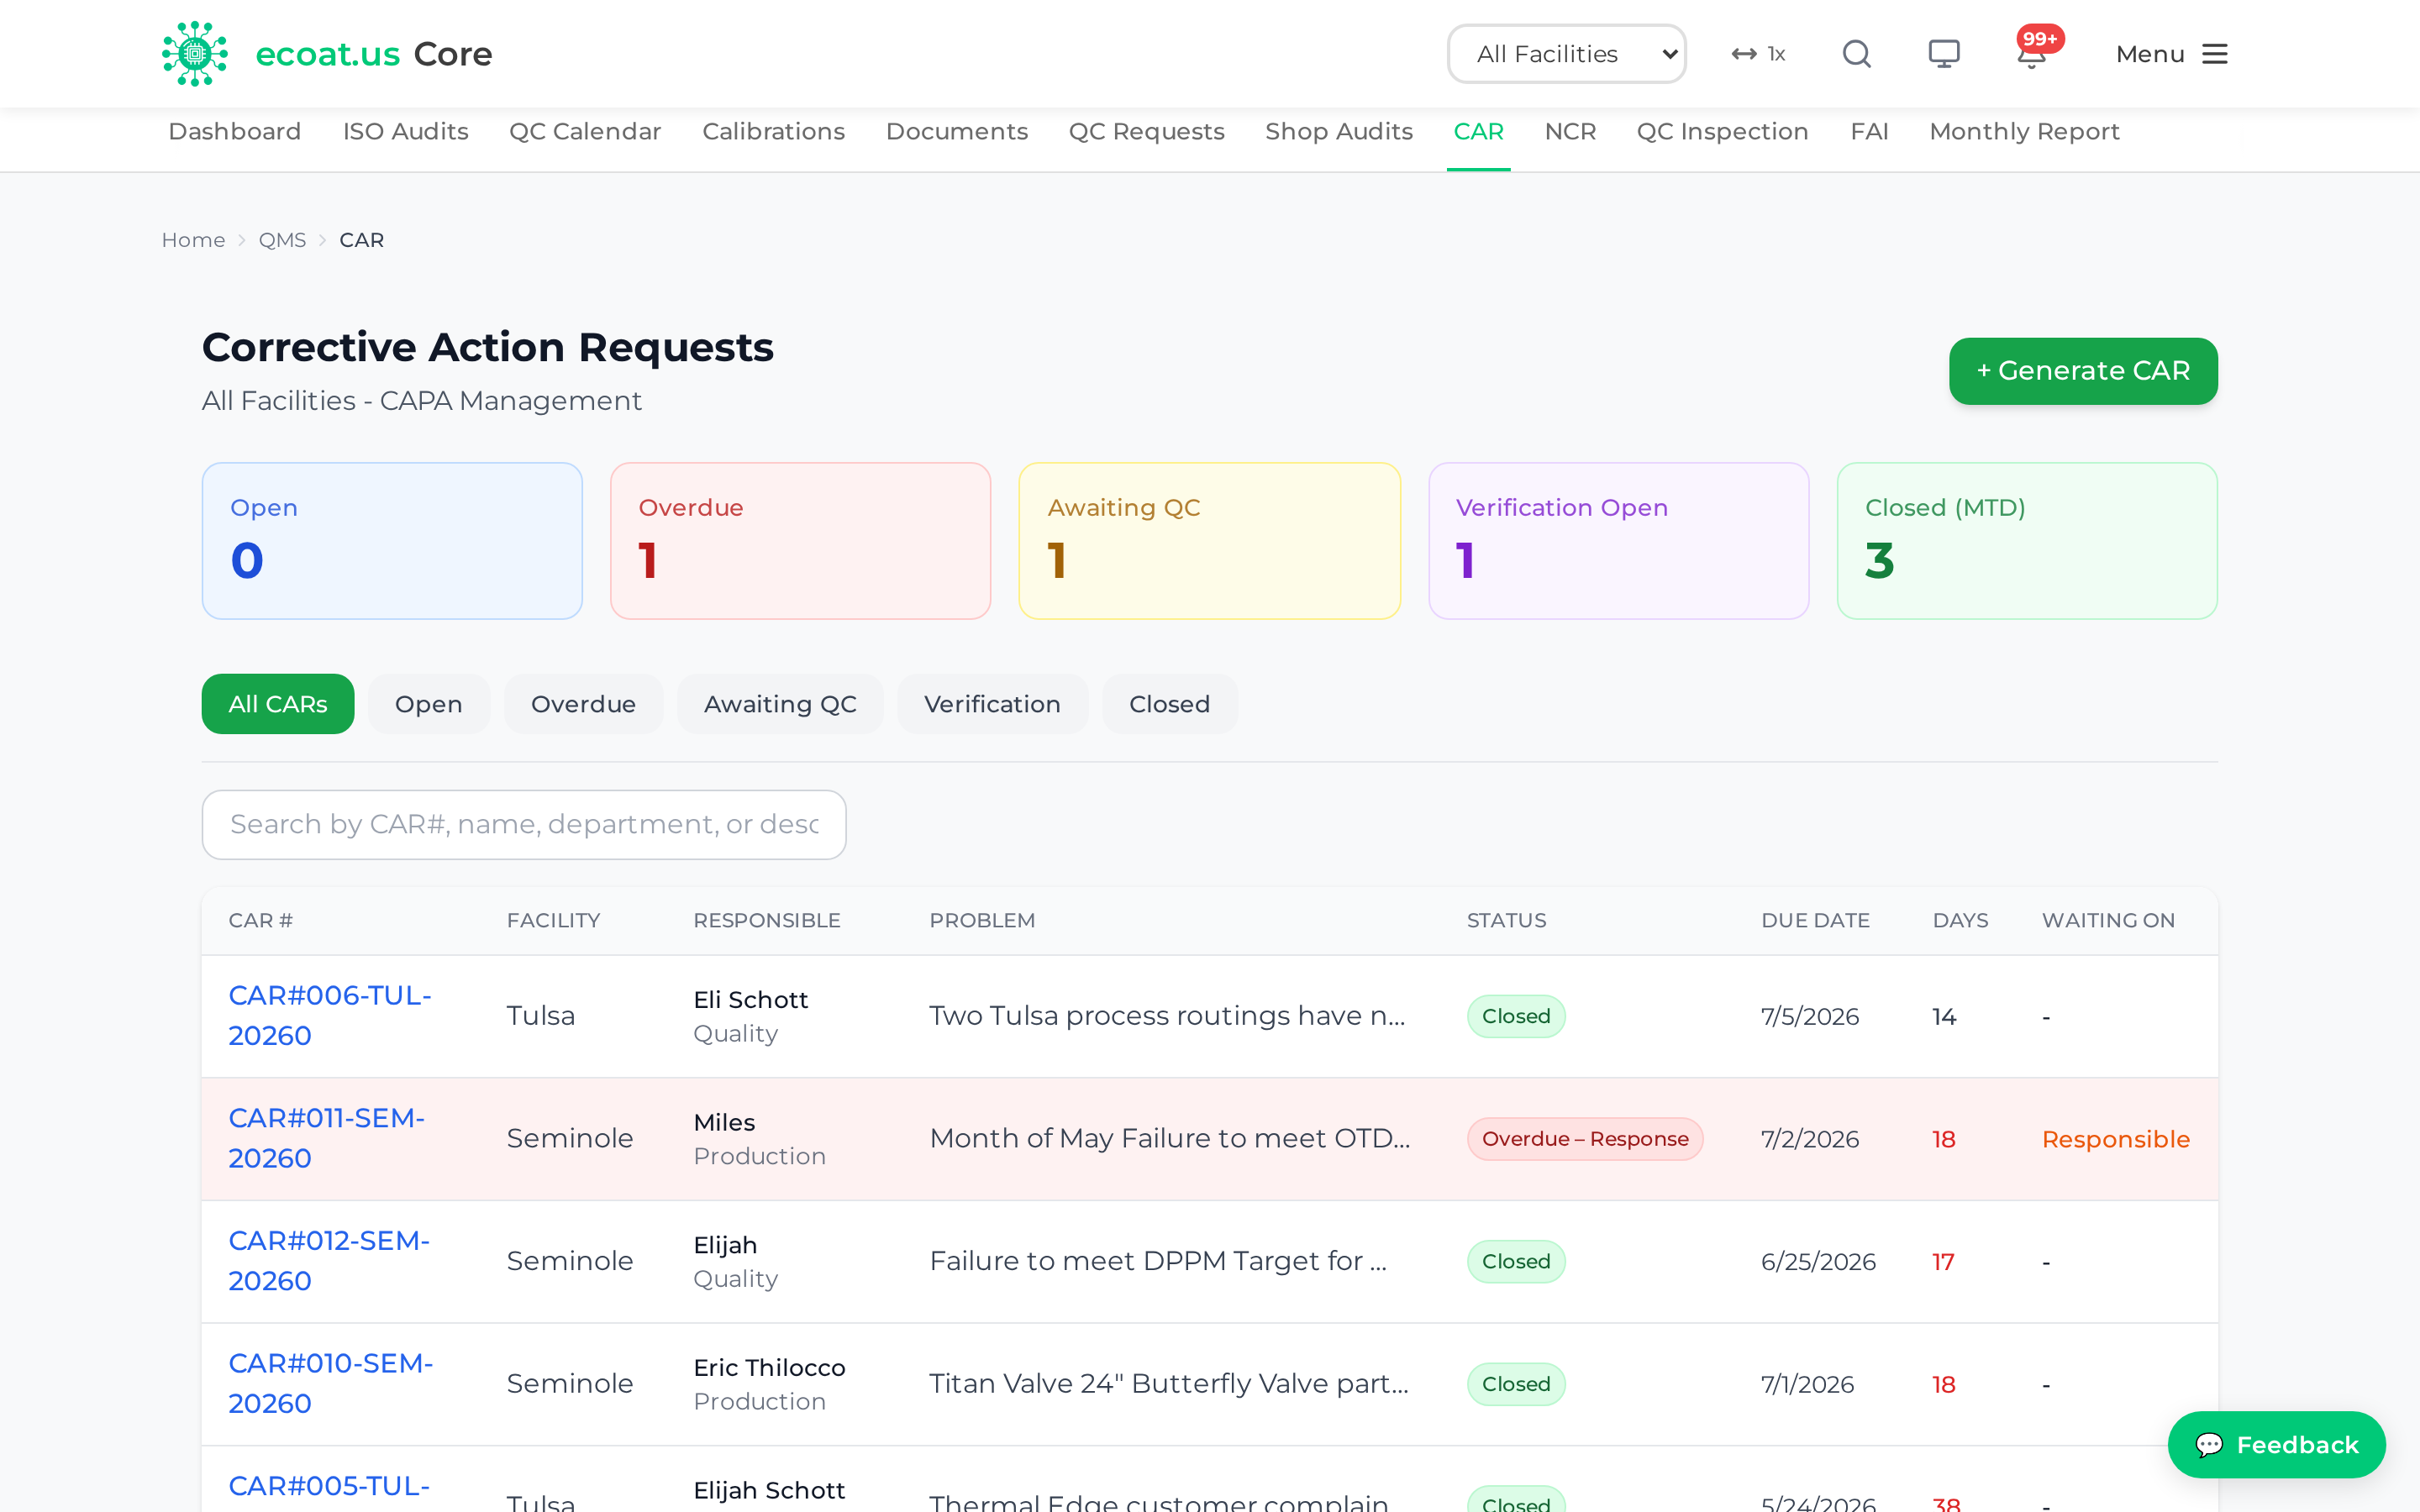
A CAR is the formal process for fixing a problem at its root, following the 8D methodology with a 5-Why root-cause analysis. It's about correcting the process, and it moves through eight tracked statuses from creation to closure. Open it from QMS → Nonconformance ▾ → CAR.
Who creates CARs
Permissions: Only Quality (and admins) can create a CAR — look for the Generate CAR / + CAR button. The department assigned to a CAR responds to it, but they don't open it.
The 8-status workflow
| Status | Who acts | What it means |
|---|---|---|
| Open-Issued | Quality | CAR created, responsible party notified |
| Open-In Progress | Responsible | They clicked "Start Work" |
| Submitted-Awaiting QC | Quality | 8D response submitted for review |
| Rejected-Action Required | Responsible | Quality sent it back for revision |
| Accepted-Verification Open | Quality | Response accepted; 30-day verification begins |
| Closed | Quality | Effectiveness verified |
(The remaining transitions are re-submit after a rejection, return from verification, and reopen — see below.)
Responding to a CAR (assigned department)
- Open the CAR and click Start Work.
- Complete the 8D sections. D3 Containment, D4 Root Cause (the 5-Why), and D5 Corrective Actions are required; D6 Validation, D7 Prevent Recurrence, and D8 Closure Notes are optional.
- Your work auto-saves every 60 seconds, and you can click Save Draft anytime — a draft does not submit the CAR.
- When it's complete, click Submit to QC.
Tip: Click the Ask Skippy button for AI-assisted suggestions while you fill in the 8D response.
Extensions, verification, and reopening
- Need more time? Click Request Extension, pick a new date, and give a specific reason. Request it before the due date passes — Quality approves or denies it.
- Quality review: Quality accepts a submitted 8D (moving it to a 30-day verification period) or rejects it back with feedback. After verification, Verify & Close closes the CAR.
- Reopen: Quality can reopen a closed CAR if the issue recurs; it returns to Open-In Progress with a fresh due date.
Overdue CARs escalate automatically — a manager is notified at 7 days overdue, a director at 14. CAR numbers look like CAR#001-FAC-2026 (sequence-facility-year).
NCR — Non-Conformance Reports
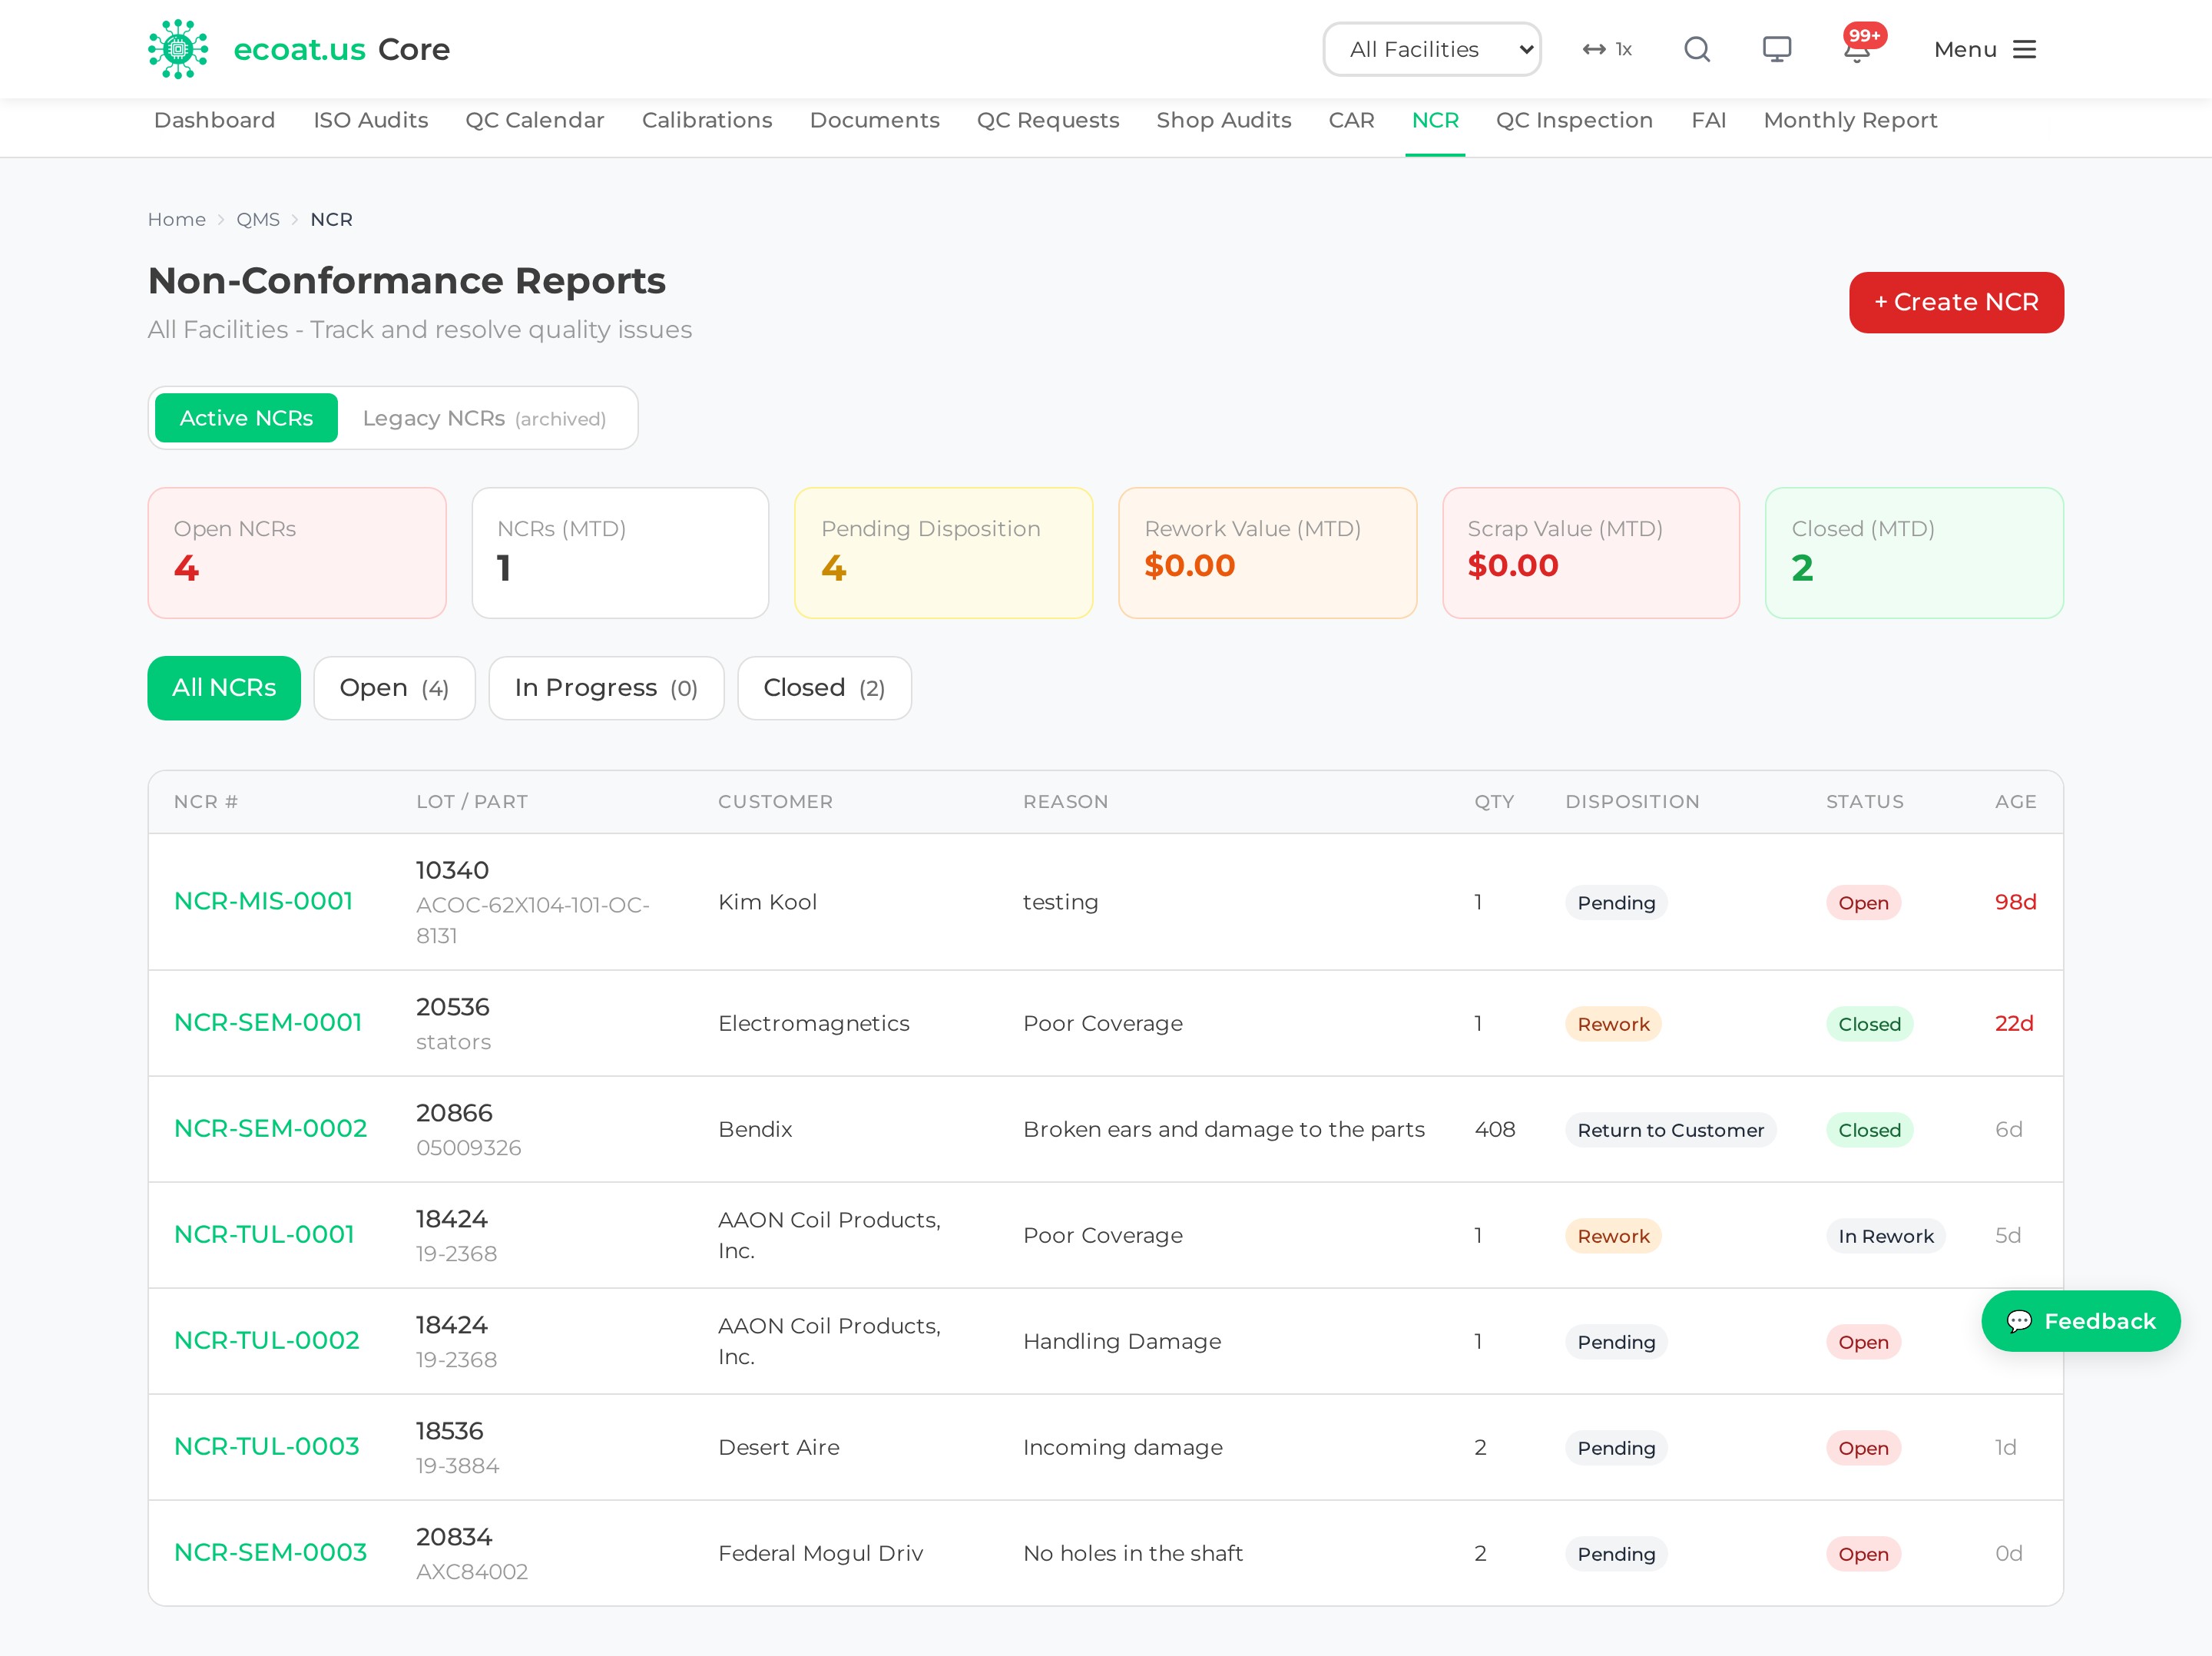
An NCR documents non-conforming material and decides what to do with it. Where a CAR fixes the process, an NCR handles the physical parts — return, scrap, rework or release — and records the cost.
The workflow
Open → Disposition → Closed. Anyone can open an NCR; Quality decides the disposition; the system closes it with the cost recorded. Rework is the exception: it keeps the NCR open until the parts come back.
Create an NCR
- Go to QMS → Nonconformance ▾ → NCR and click + Create NCR.
- Search for and select the affected lot number.
- Fill in the defect type, reason, quantity affected, and a description.
- Attach evidence photos and click Submit NCR.
Set the disposition
Open the NCR and click through to Set Disposition. Pick one of seven outcomes:
| Disposition | Meaning |
|---|---|
| Rework | Fix and use. Requires Rework Hours (cost = hours × $75/hr × 1.20 overhead). Stays open until re-inspected. |
| Rework (Customer Fault) | Reworked the same way, but the fault is the customer's, so it is recorded at $0 cost to us and stays out of our COPQ. Also stays open. |
| Return to Customer | Ship the material back. |
| Escape | The non-conformance reached the customer. Terminal, and the outcome that drives reportable External DPPM. |
| Scrap Onsite | Material is destroyed. Requires a Scrap Value ($). |
| Credit Issued | Credit the customer. |
| Use As Is | Accept and release the material as-is — either Quality signs off or the customer approves coating it anyway. |
Everything except the two Rework options closes the NCR immediately.
Classification — Internal or Escape
Below the disposition, the form asks you to classify the non-conformance:
- Internal — caught in-house; it did not reach the customer. This is the default.
- Escape — it reached the customer, and it counts toward External DPPM.
Set this deliberately on every NCR. External DPPM is the number reported back to the customer, so leaving an escape classified as Internal understates the figure you will be held to. Note that Escape appears in two places: as a disposition (the material is already gone, so there is nothing to release) and as this classification (which you can set alongside a Rework, for instance, when escaped parts come back to be fixed).
Finish with Disposition Notes — they are required — and tick Create Corrective Action Request (CAR) if the non-conformance points at a systemic problem that needs root-cause work.
Adding photos after creation
You don't have to attach everything up front. Open an existing NCR and use the evidence upload on the detail page to add photos later. Core can even run an AI defect-classification pass on uploaded photos to suggest the defect type.
NCR numbers look like NCR-SEMINOLE-2026-0015 (facility-year-sequence).
Legacy NCRs
Seminole's older non-conformances, migrated from Cognito Forms, live on their own page under Legacy NCRs (reachable from the NCR dashboard). The list carries Total Records, Pending Disposition, Dispositioned and Completion Rate cards, a search box, and a Disposition Status filter (Pending, Accept as is, Credit requested, Return for rework, Scrap onsite, Rework In-house). Days Open is shown on undispositioned rows and colours from green to red as it climbs.
Open a record to see its original Cognito data read-only, and edit the Disposition, Replacement Cost ($) and Notes — that is all these records support. Use it to close out old history; new work belongs on the main NCR page.
Shipping Holds
Shipping Holds is the queue of shipments a quality gate has blocked. Open it from QMS → Nonconformance ▾ → Shipping Holds. When a shipping worker hits Notify QC on a blocked BOL, the hold lands here with a link straight to each record that is blocking it.
Tabs across the top read New, Acknowledged, Cleared and All, with a red count on New. Each card shows the BOL, the facility, and a Blocking issues list naming the lot, the gate and the message, with an Open → link to the record. You can filter by facility, and quality users get an Only mine checkbox.
Quality has two buttons on each open hold: Acknowledge (so shipping knows it's being looked at) and Clear — notify shipping, which releases the shipment and tells the shipping worker it's ready to go. Everyone else sees the hold read-only.
QC Inspection
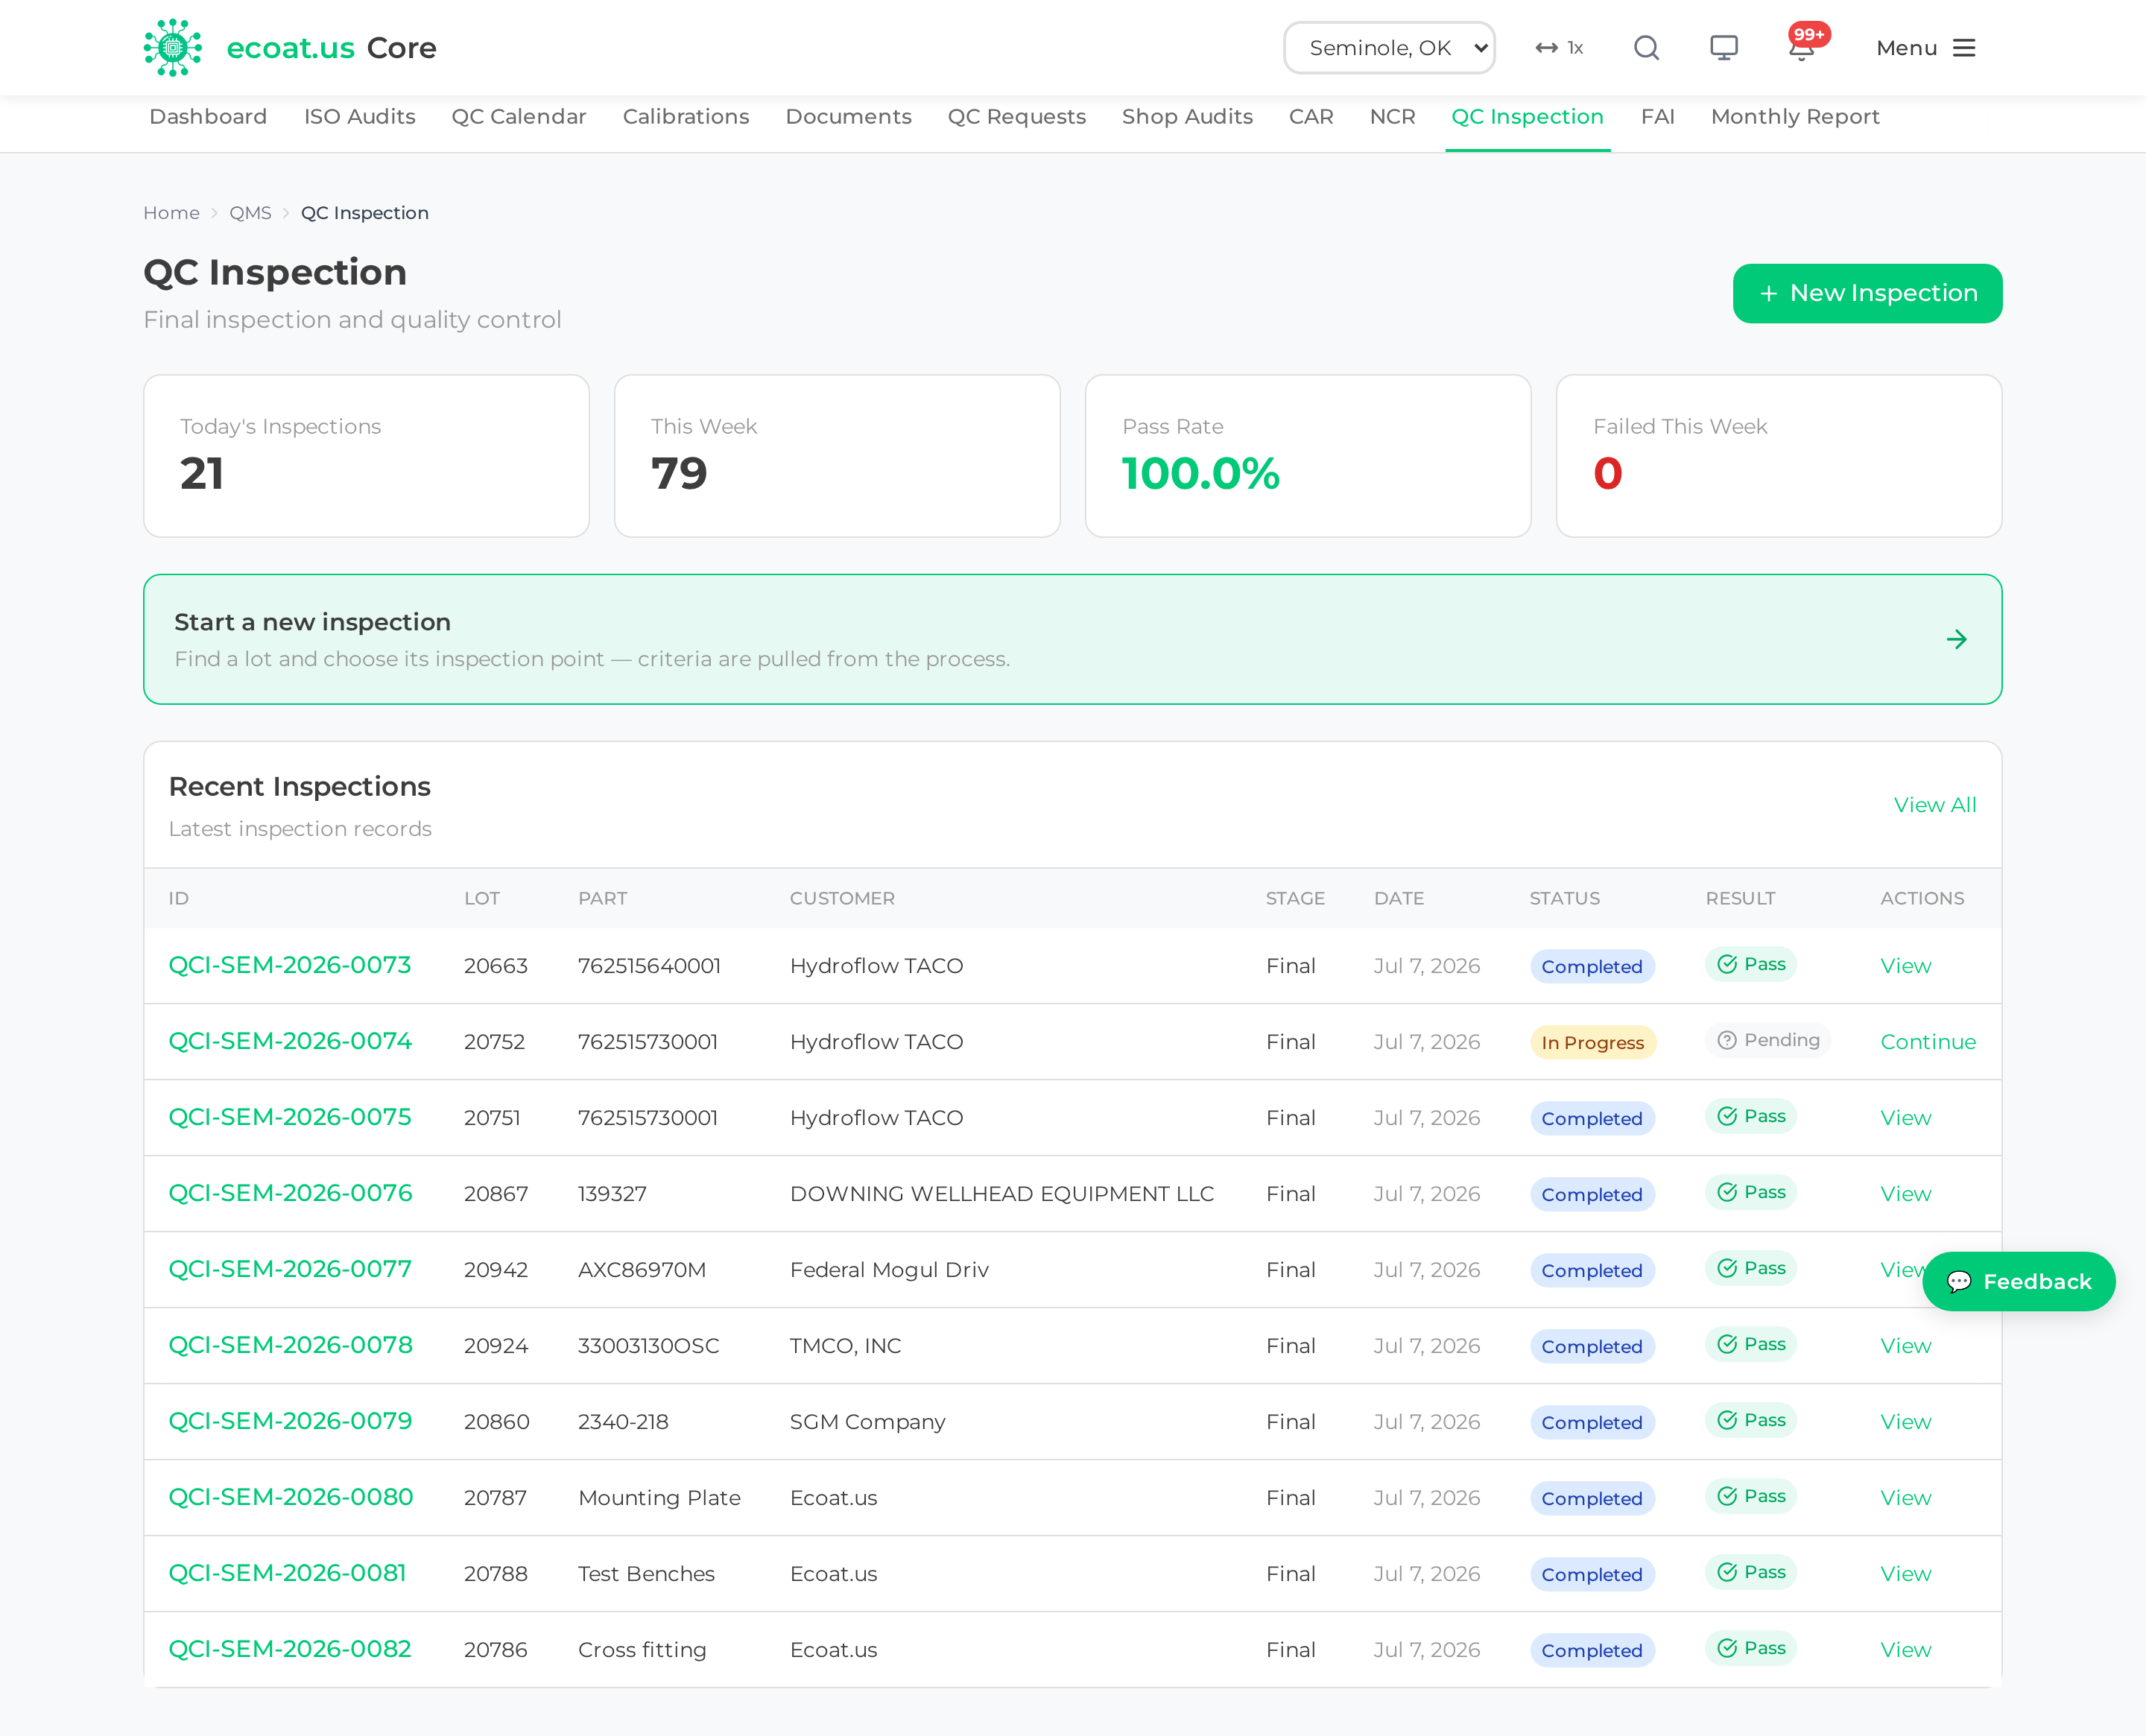
A QC Inspection is a formal quality check on coated parts. Core builds the check sheet from the product's own process route — you don't pick a template — flags out-of-spec readings as you enter them, and keeps the readings, photos and result as the traceable record for the lot. Open it from QMS → Inspections ▾ → QC Inspection.
Start an inspection
- Click New Inspection.
- Scan or enter Lot # * — scan the traveler QR code, or type the lot number and pick it from the results. Part number, customer, description and quantity all come from the lot; the inspector never types them.
- Pick an Inspection Point *. Core derives the list from the product's process route: one point per stage, each showing its own status — Not started, In Progress, Pass or Fail — and ending with the Final Inspection point.
- Enter Quantity Being Inspected * (the lot total is shown underneath) and click Start Inspection.
If someone already has an inspection running at that point you'll see "An inspection is already in progress for this point" with a Continue button instead — use it rather than starting a second one.
At the coil plants (Tulsa, Cleveland and Mission) the list carries two extra fixed points: Incoming, ahead of everything, for the condition of coils on receipt, and Outgoing, after Final, for the dock check.
Skipping a point
You can start a later point even when earlier ones haven't been inspected — Final Inspection is the only hard gate on shipping. Core asks first: a dialog headed Skipping earlier inspections? lists what would be missed, and you either Go back or Mark missed & continue.
Skips are recorded against the lot, and a point that has been passed over shows a Skipped N× badge on the point picker. That badge is the whole point of the feature — it lets Quality see a pattern of the same check being skipped week after week.
Enter the readings
Each check on the sheet carries its spec, and your entries save as you go.
- Numeric fields turn red with an "Out of spec" message when the value falls outside the min/max. A value inside spec just looks normal — no red, no warning. Each numeric field also has a Not recorded by operator checkbox for values nobody logged (an oven temp, say); that is never an out-of-spec and never blocks you.
- Multi-reading (DFT and other film-build checks) open with three boxes. Use + Add reading for more, up to 20, or remove rows you don't need. The live average is what gets stored and specced — the individual readings are kept alongside it for the certificate record. Out of spec here reads "Average out of spec".
- Pass / Fail buttons cover the yes-no checks, and select and free-text parameters appear where the route calls for them.
- Every check has its own Note (optional) box underneath. Use it — a note against the individual reading is far more useful later than one long note at the end.
The cure test
Coated parts carry a solvent-rub cure test, and which one you get depends on the coating:
| Coating | Check |
|---|---|
| Ecoat, Powder (and FinKote) | MEK Cure Test |
| ZPEX, ZPEX II | Solvent 99 Cure Test |
| CARC, General Industrial | none |
Both are Pass / Fail / N/A, and both are required — the inspection will not complete until the cure test is answered. If you try, Core tells you exactly what's outstanding: "Fill required fields: …". The cure test is always on the final inspection, and on coating and curing points too.
Air PSI — the coil leak check
At the coil plants, Air PSI is recorded as a number at both ends of the job so you can prove the coil held pressure and no leak was introduced in between:
- On the Incoming checklist: an Air PSI condition check (OK / Not OK / N/A) plus an Air PSI reading (psi) number, one row per coil.
- At the packing point: Air PSI reading (psi) again — the outbound half of the check.
- On the Outgoing checklist: PSI recharge matches drawing / traveler (OK / Not OK / N/A) plus an optional Air PSI (per coil) number, again one row per coil.
The PSI number fields are multi-reading fields, so + Add reading gives you a row per coil, up to 20. None of them are mandatory — no customer requires a per-coil reading — but the inbound and outbound numbers together are what turn "the coil looked fine" into evidence.
Photos
The photo section is on every inspection, split into two groups:
- Part / Product photos — + Add photo. Add as many as the job needs.
- Traveler photos — + Add traveler photo. Up to 10.
A final inspection requires at least one traveler photo. A part photo is never required — plenty of QC teams photograph the traveler rather than a separate part, and demanding both blocked them. The Traveler group shows Required for final inspection until you add one, then flips to Added; try to complete without it and Core scrolls you back to the section and highlights it.
Picked the wrong photo? Each tile has Retake to replace it and a red ✕ (Delete photo) to remove it outright.
Complete the inspection
Click Complete Inspection at the bottom of the form. The modal asks for:
- Overall Result * — Pass, Conditional, or Fail.
- Final inspection — a toggle, already set from the point you picked. At Seminole, which performs a final inspection only, there is no toggle: the point you picked decides, and the form tells you which you're doing.
- Meets customer requirements — a toggle, on by default.
- Notes — optional.
Then click Confirm.
On a Final inspection that passes, the lot is finished and its on-time-delivery (OTD) is calculated. On an in-process inspection the results are recorded and the lot can advance, but it stays open for OTD — and Core offers a Move to next area prompt so you can push the lot along without leaving the page. You can always Skip that.
A Fail does not silently raise an NCR. The completed inspection shows an Inspection Failed panel with the out-of-spec count and a short form — Reason, Failed Quantity, and notes — and you click Create NCR to raise it, linked to the inspection.
The quality team can reopen and edit a completed inspection with Reopen to Edit (this closed an ISO 9001 finding). Inspection IDs look like QCI-SEM-2026-0001.
FAI — First Article Inspection
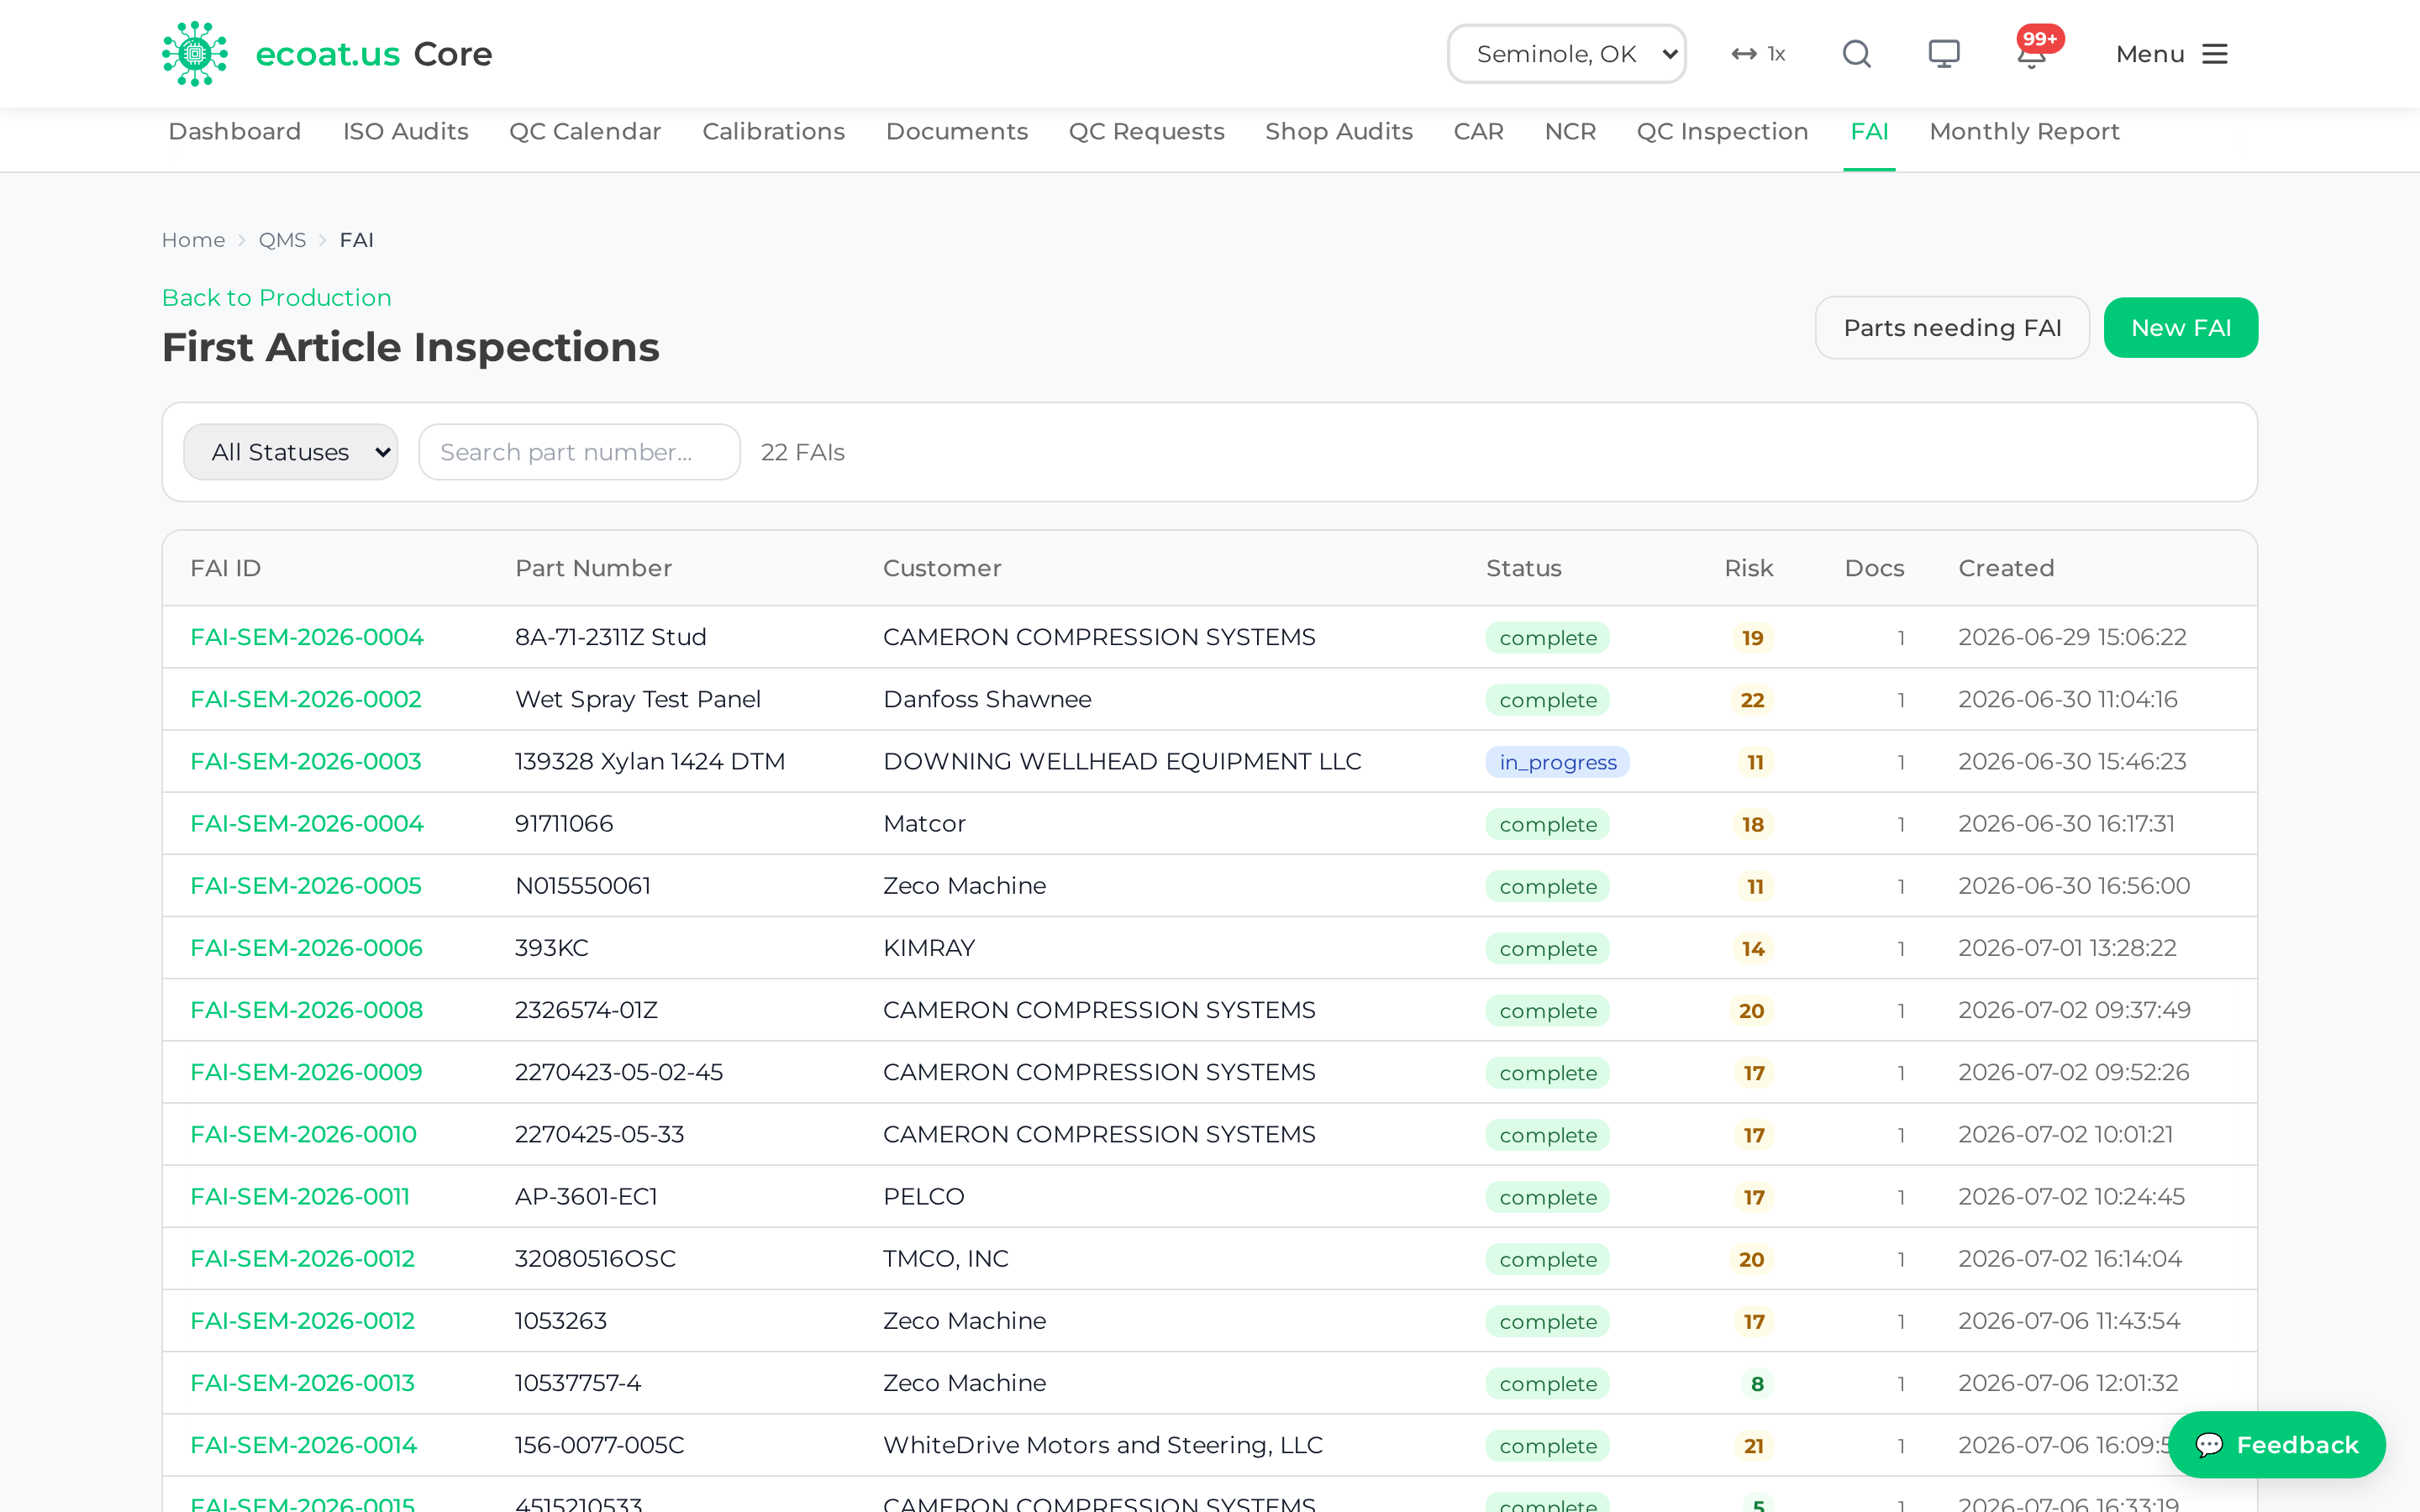
An FAI is the up-front inspection you do on the first article of a part to confirm the process is set up correctly before a full run. Core builds it as a short wizard and includes a risk assessment.
Create an FAI
- Go to QMS → Inspections ▾ → FAI and click New FAI. (The Parts needing FAI button flags parts that don't have one yet — click Create FAI next to any of them.)
- Step 1 — Part & Product: search for the part number. If it's brand new, click to enter new-product mode and set its product type (Coil, ZPEX, Powder, Gen. Industrial, CARC, ZPEX II) plus a customer.
- Step 2 — Design: build the process across its stages (substrate, pre-treatment, coating, masking, preservation).
- Step 3 — Risk: complete the risk assessment and sign off. Any area flagged high risk requires a mitigation before the FAI can be completed.
- Click Mark Complete — enabled once every checklist item is done.
A completed FAI can be reopened with Reopen to Edit if you need to change something.
Tip: If Mark Complete is greyed out, a "Still needed to complete this FAI" panel lists exactly what's missing — usually an unfinished checklist item or an un-mitigated high-risk area.
The template library
The Template Library button on the FAI page opens the Process Template Library — the reusable process routings the FAI wizard can apply, so you're not rebuilding a routing you have already designed once. You can review any template's steps here without starting an inspection: click a template to expand it and see its step list, step types, and any testing required.
Quality, production and admin users can also curate the library: + New template creates a blank one to author steps into, Add existing process flags a process you already have as reusable, and Remove takes a template out of the library. Removing only stops it appearing as a template — the process itself and any lots using it are untouched.
Customers
Quality owns the customer master. Open it from QMS → Customers ▾ → Customers. This is where customers are added and edited along with their quality and certification contacts — and those contacts are what the survey and certificate emails go to, so a stale one here is a survey nobody answers.
Search the list, click Add Customer, or use the pencil icon on a row to edit. Alongside the name, email and billing/ship-to addresses you'll find Quality Contact, Quality Email and Certification Email (which takes several addresses separated by commas), plus Inactive and Credit Hold flags that show as chips on the list.
Permissions: Limited to the quality team and production admins. Everyone else gets "Quality access required".
Surveys
Customer Surveys measure satisfaction and monitor feedback. Open it from QMS → Customers ▾ → Surveys.
The top of the page carries five figures — Sent, Responded, Avg Score, NPS and Response Rate — with a per-facility breakdown when more than one plant is in view. The table below lists every survey with its status (sent, responded, draft, expired) and score.
- New Survey picks a facility and customer, offers that customer's known quality and certification contacts to send to, and hands you a link to pass on.
- Click a customer's name on a responded row to read their answers question by question.
- Preview survey shows the form exactly as the customer sees it; Export to Excel downloads the completed surveys for the current selection.
Monthly Report
The Monthly Quality Report pulls the month's quality metrics into one document with a bit of manual narrative, then generates the finished report in one click.
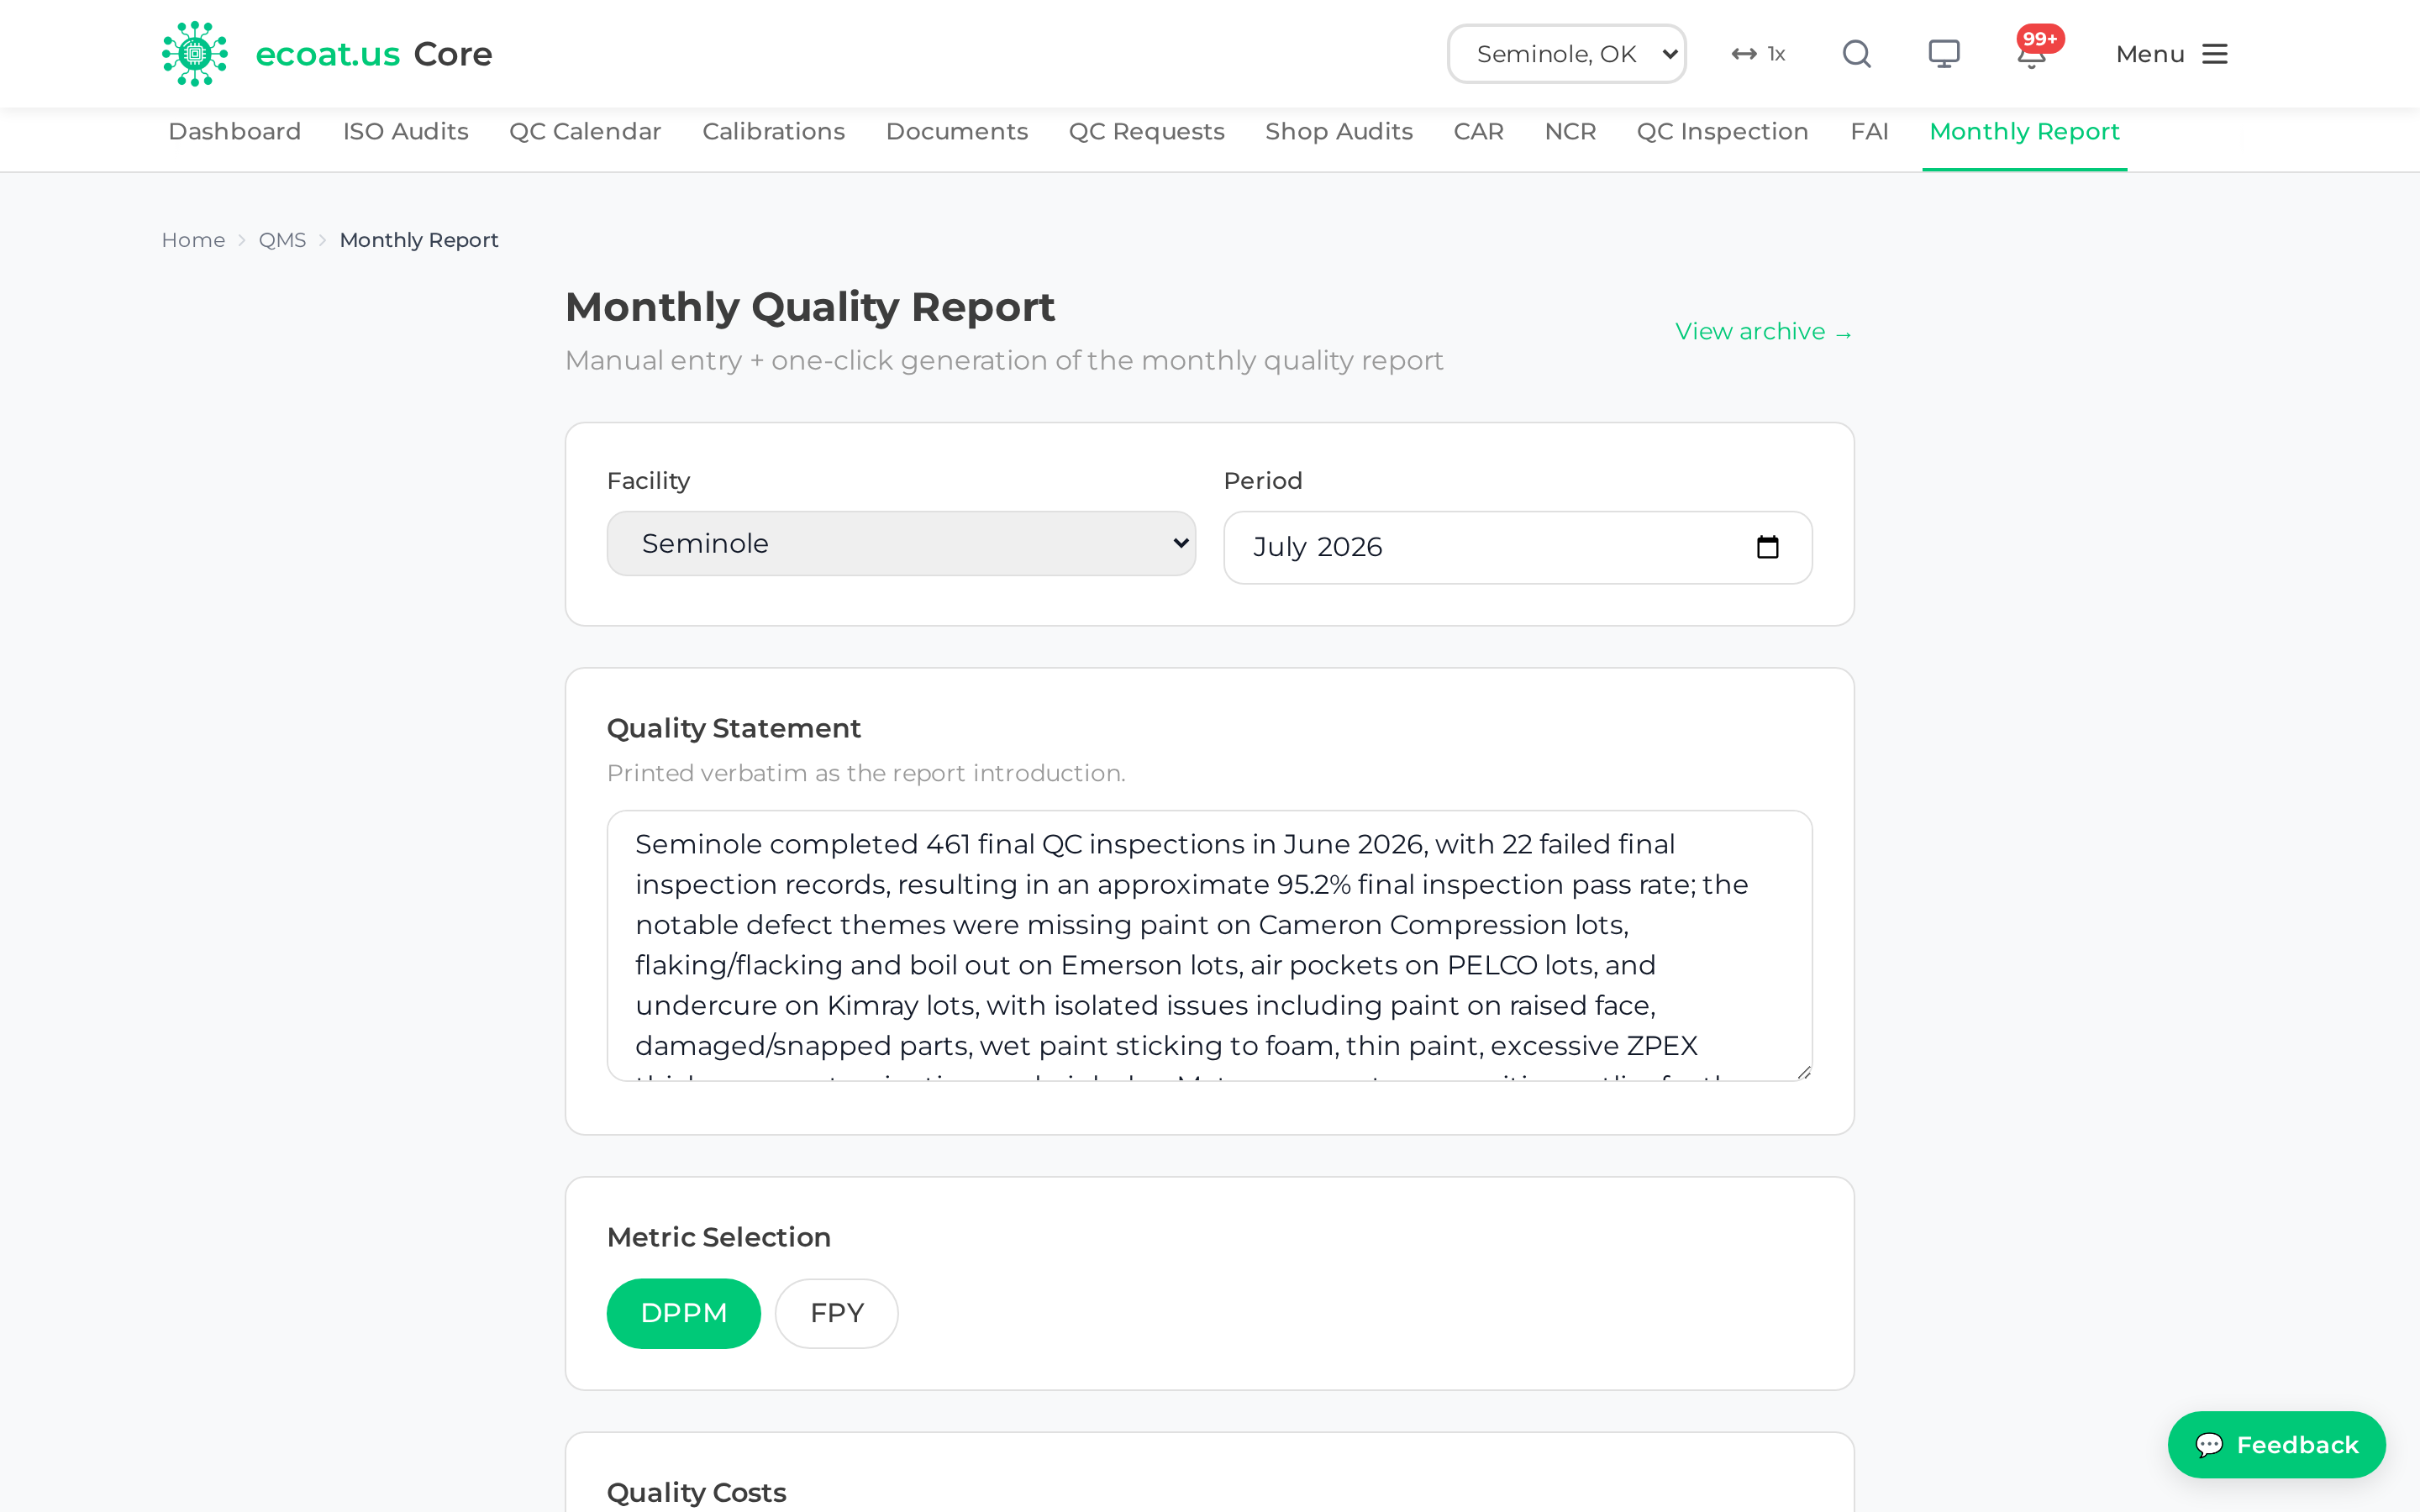
- Go to QMS → Records ▾ → Monthly Report and choose the period (month) at the top.
- Write the Quality Statement — a short summary of the month.
- Choose which metrics to include and fill in the Quality Costs.
- Click Save & Generate to produce the report.
Past reports live under Monthly Report → Archive.
Tip: Fill in the quality statement while the month is fresh in your mind — the numbers generate themselves, but the narrative is the part only you can write.
Inventory
Inventory
The Inventory module is where you track everything ECOAT buys, stores, and consumes — from paint and pretreatment chemicals to shop supplies. It keeps on-hand quantities accurate across all four facilities (Seminole, Tulsa, Cleveland, and Mission), tracks material batches for traceability, and drives purchasing so you never run out of a critical item.
The Inventory tab bar groups its screens into four dropdowns — Stock ▾ (Items, Item Master, Batches, Certs), Orders ▾ (Orders, Buyer Worklist, Receiving), Movement ▾ (Transactions, Transfers, Cycle Count), and Reports ▾ (Reports, Report Builder). Dashboard sits on its own. Paths below are written as Inventory → Orders ▾ → Receiving: click the module, open the dropdown, pick the screen.
Almost every screen respects the facility selector in the top-right corner. Set it to the plant you work at and the lists, counts, and reports below will scope themselves to that location.
Permissions: Most people can view inventory and record receipts, counts, and transfers. Creating and submitting purchase orders is limited to the Purchasing team. Editing item master data (reorder points, vendors, pricing) is limited to Purchasing and Admin.
Inventory Dashboard
The dashboard is your at-a-glance health check for the current facility. Open it from Inventory in the main menu (it is the default view).
It surfaces the numbers you care about most: how many items are below their reorder point, batches expiring soon, and quick links into the busiest screens (Receive, Items, Purchase Orders). Use it as your morning landing page, then jump to the specific task from there.
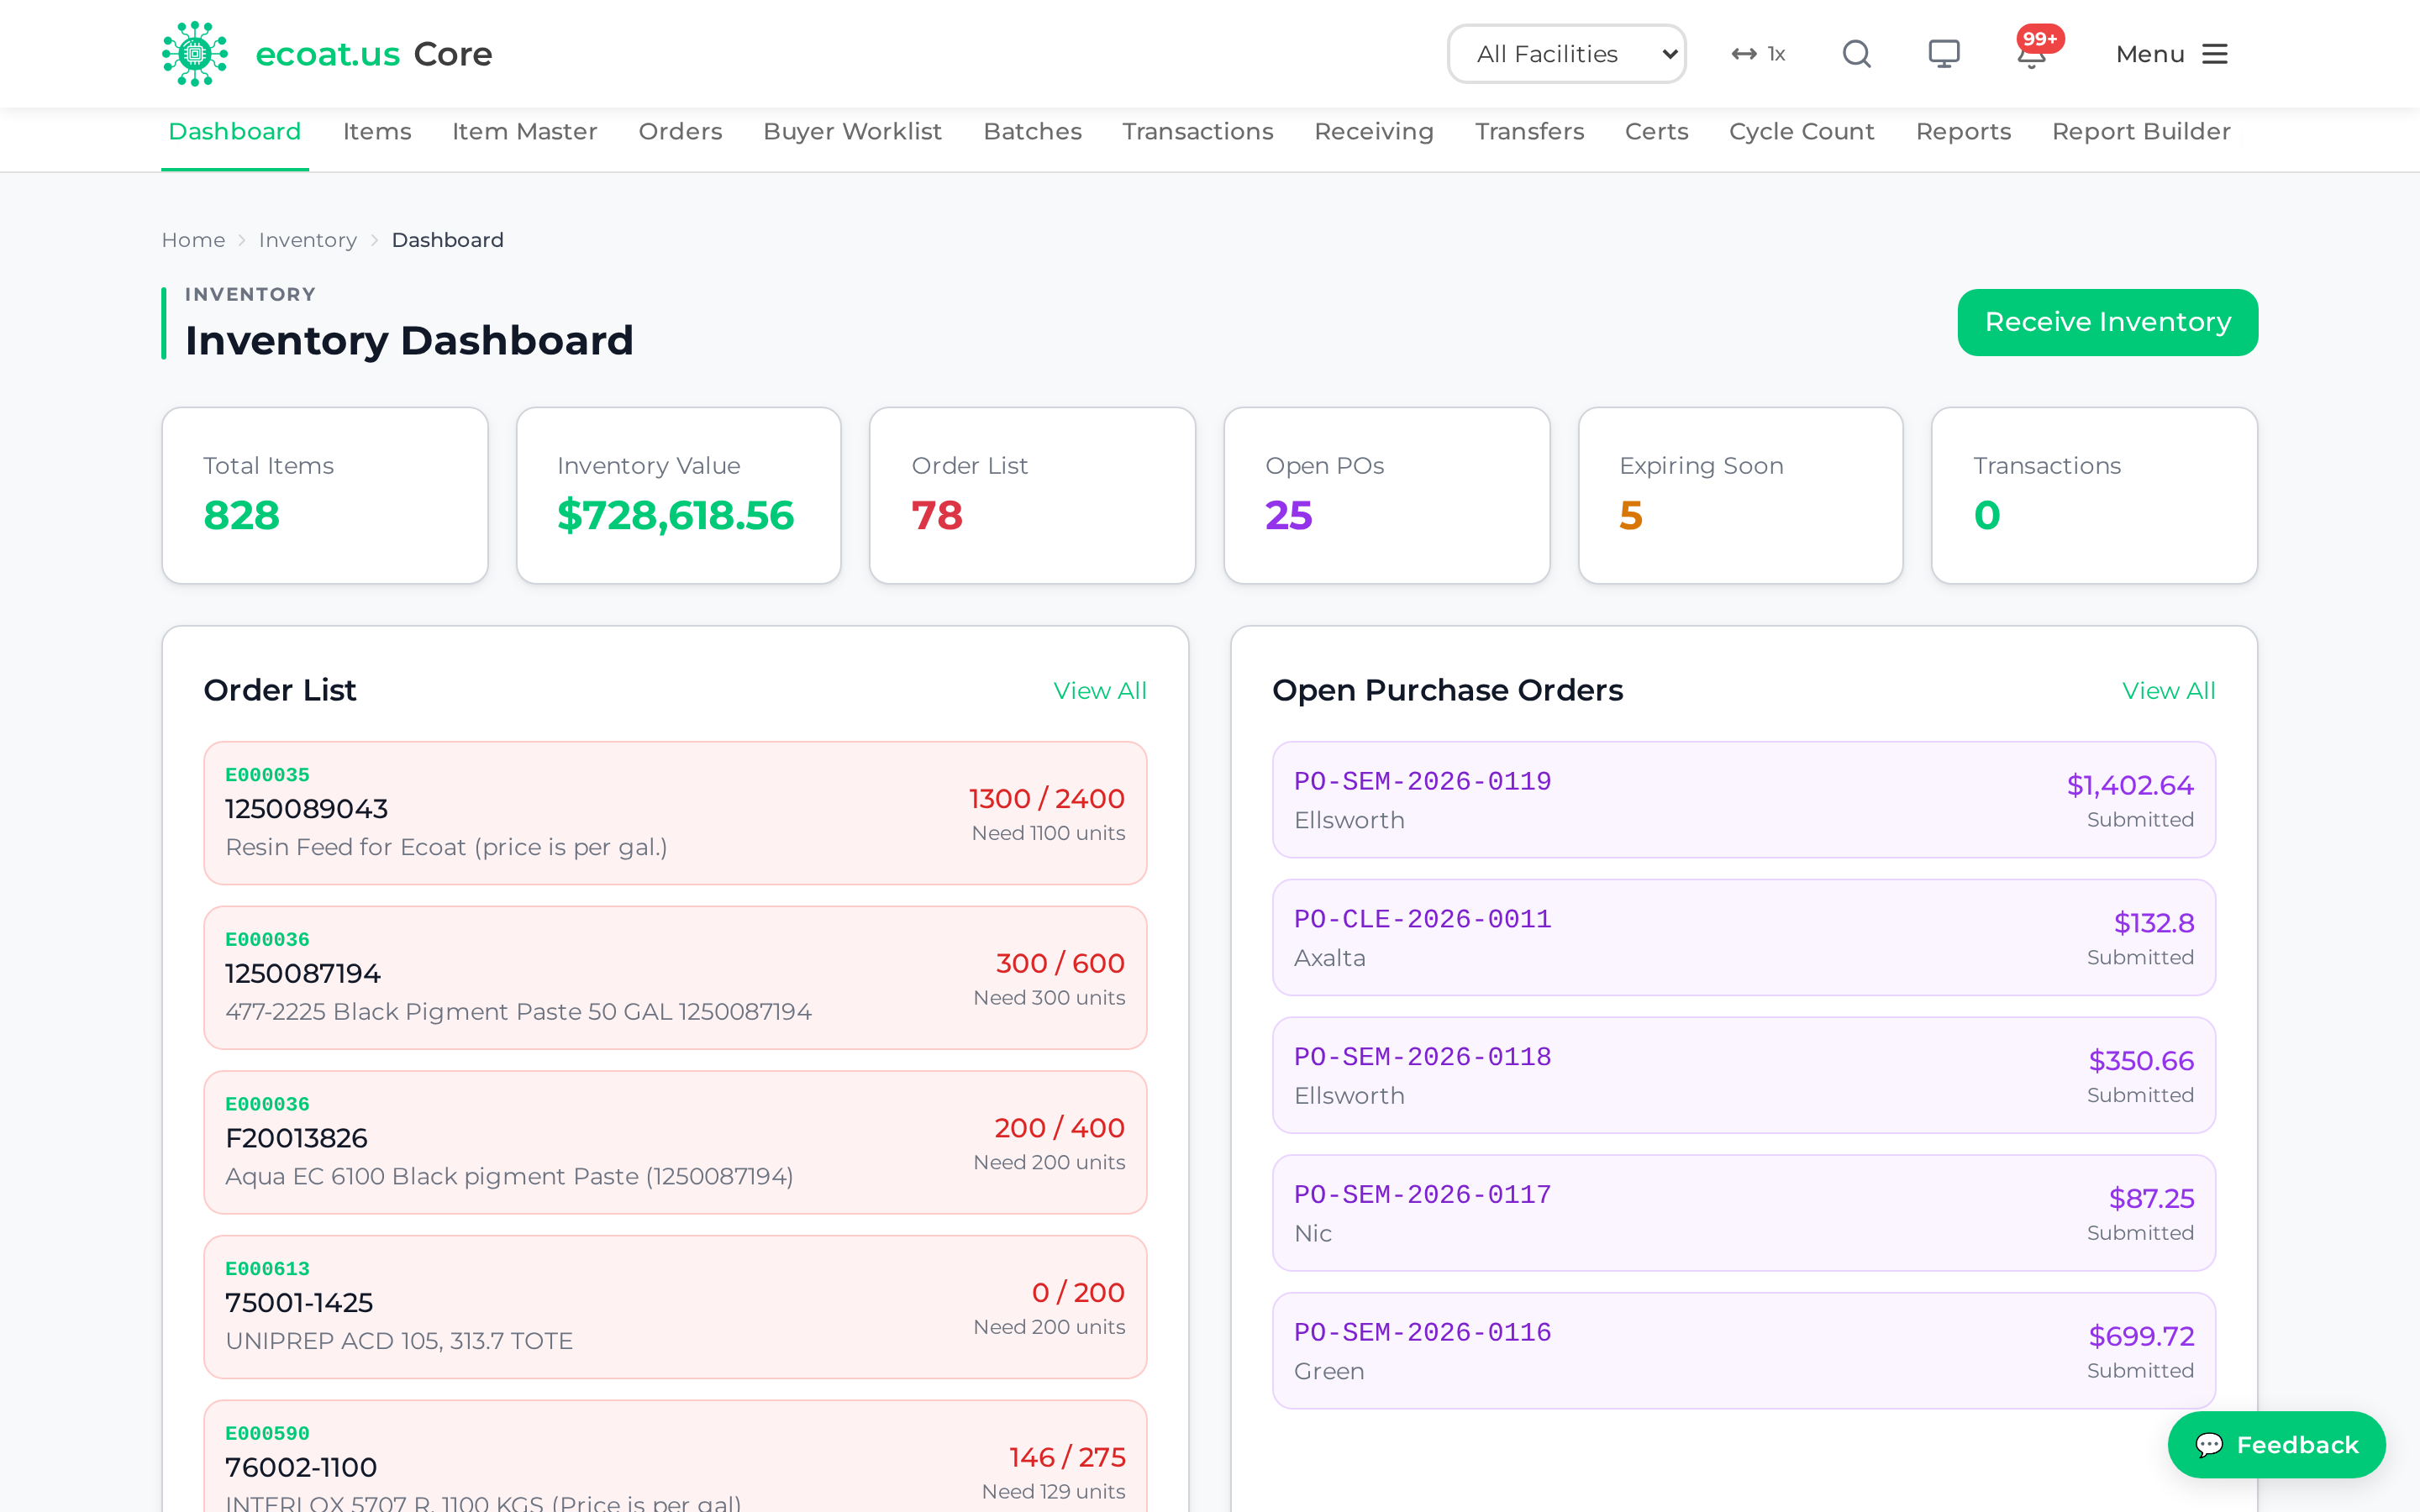
Tip: If the numbers look wrong, check the facility selector first — the dashboard only counts the facility you have selected.
Items
The Items screen is the working list of every stocked item at the selected facility. Open it from Inventory → Stock ▾ → Items.
Each row shows the part number, description, vendor, on-hand quantity, a facility badge (so you always know which plant the item belongs to), and the manufacturer part number (MFG Part#) for cross-referencing vendor paperwork. A colored stock indicator tells you the situation at a glance.
View and search items
- Go to Inventory → Stock ▾ → Items
- Search by part number, description, or vendor
- Click any row to open the item detail
Edit an item
- Click an item row to open its detail panel
- Click Edit
- Update the fields you need — description, vendor, code, location, unit price, UOM, reorder point, reorder quantity, lead time, or notes
- Save
Quick actions from an item
From the item detail you can jump straight into related work:
- Receive Product — opens Receiving with this item pre-loaded
- Make Transaction — create an adjustment or issue for this item
- View Batches — see every batch for this item
- View Transactions — see the full movement history
Stock indicators:
| Indicator | Meaning |
|---|---|
| Green | Above reorder point |
| Yellow | At or below reorder point |
| Red | Out of stock |
Tip: To change how much triggers a reorder, edit the item and adjust Reorder Point (the trigger level) and Reorder Qty (how much to order). A good starting formula is Reorder Point = (Daily Usage × Lead Time) + Safety Stock.
Item Master
The Item Master groups the same product across all four facilities so you can compare and manage them together. Open it from Inventory → Stock ▾ → Item Master.
Products are grouped by MFG Part#, with a canonical (standardized) name and a facility matrix showing on-hand quantity at Seminole, Tulsa, Cleveland, and Mission side by side. A warning icon (⚠️) flags products whose names differ between facilities so you can clean up inconsistent naming.
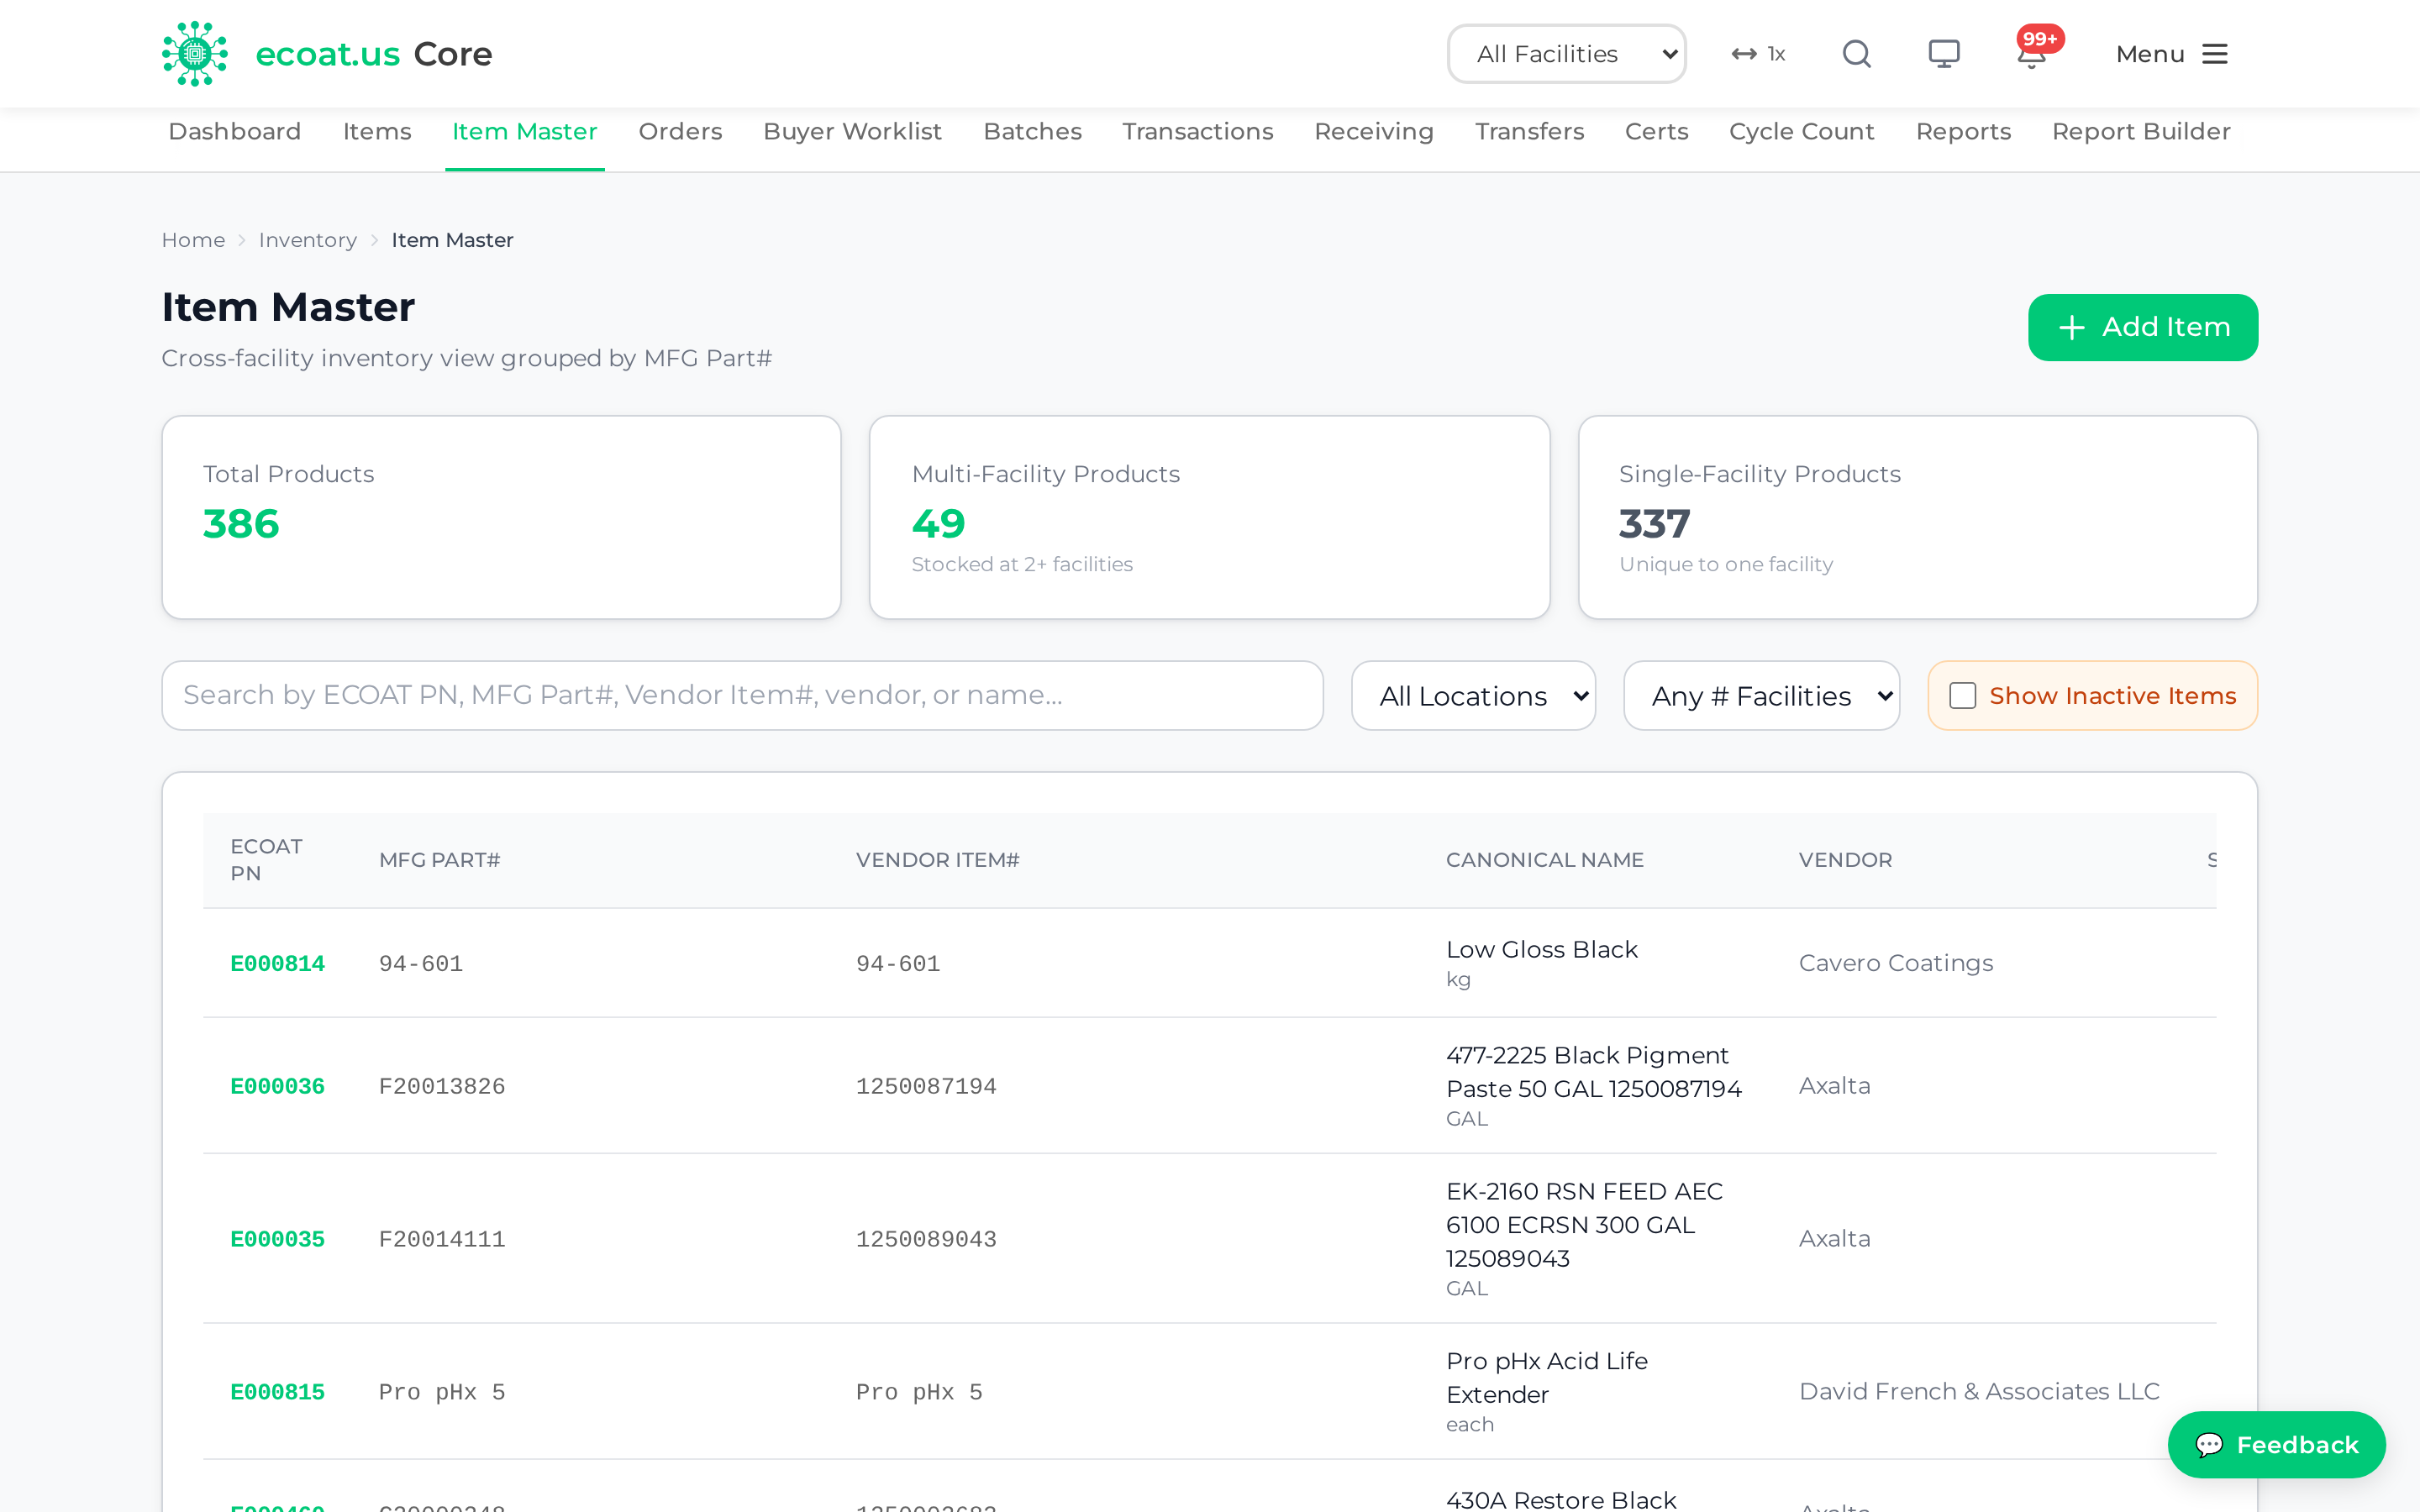
Compare and edit a product across facilities
- Go to Inventory → Stock ▾ → Item Master
- Click a product row to expand its per-facility breakdown
- Click any facility row (it has a pencil icon) to edit just that facility's copy
- Update description, vendor, category, location, pricing, or reorder settings
- Save
Note: Editing here updates only the one facility's item. The other facilities are unchanged.
Add a new item across facilities
- Click + Add Item in the Item Master header
- Step 1 — Common fields: enter part number and description (required), plus vendor, UOM, and unit price. Flag Hazardous Material (enables an SDS link) or Critical Item if relevant, then tick the facilities to create the item at
- Click Next
- Step 2 — Per-facility settings: set location, category, reorder point, reorder quantity, qty-to-keep, lead time, inventory interval, and notes — each facility can differ
- Click Create Items
Permissions: Adding and editing items requires Purchasing or Admin access.
Purchase Orders
Purchase Orders (POs) track what you have ordered from vendors and what is still expected. Open the list from Inventory → Orders ▾ → Orders.
Create and submit a PO
- Go to Inventory → Orders ▾ → Orders and click New Purchase Order
- Select the Vendor and set an Expected Delivery date
- Click Add Item to search and add items, entering a quantity for each
- Review the total, then Save Draft or Submit
PO status flow:
| Status | Meaning |
|---|---|
| Draft | Not yet submitted, still editable |
| Submitted | Sent to vendor, awaiting delivery |
| Partial | Some items received, more expected |
| Received | All items received |
| Closed | Complete, no further action |
| Cancelled | Order cancelled |
Xero — POs are entered twice (on purpose)
Automatic Xero sync is currently turned off. When you submit a PO in Core, it does not flow into Xero by itself. Core reminds you of this right after you submit:
"PO submitted in Core. Xero sync is currently disabled — please create the matching Purchase Order in Xero manually."
So the honest procedure today is: submit the PO in Core, then create the same PO by hand in Xero. The Buyer Worklist (below) exists specifically to make that second step reliable so nothing slips through.
Permissions: The Purchasing team has full access — create, edit, submit, and cancel POs, and see every status. The Materials/Receiving team sees only open POs (Submitted and Partial) and cannot create or edit them.
Buyer Worklist
The Buyer Worklist is the checklist that keeps Core and Xero in step while auto-sync is off. Open it from Inventory → Orders ▾ → Buyer Worklist. Its header reads "Buyer Worklist — Enter in Xero."
It lists every submitted PO that has not yet been entered in Xero, with columns for PO #, Vendor, Facility, Total, and Submitted date. As you enter each one into Xero, mark it here and it drops off the list.
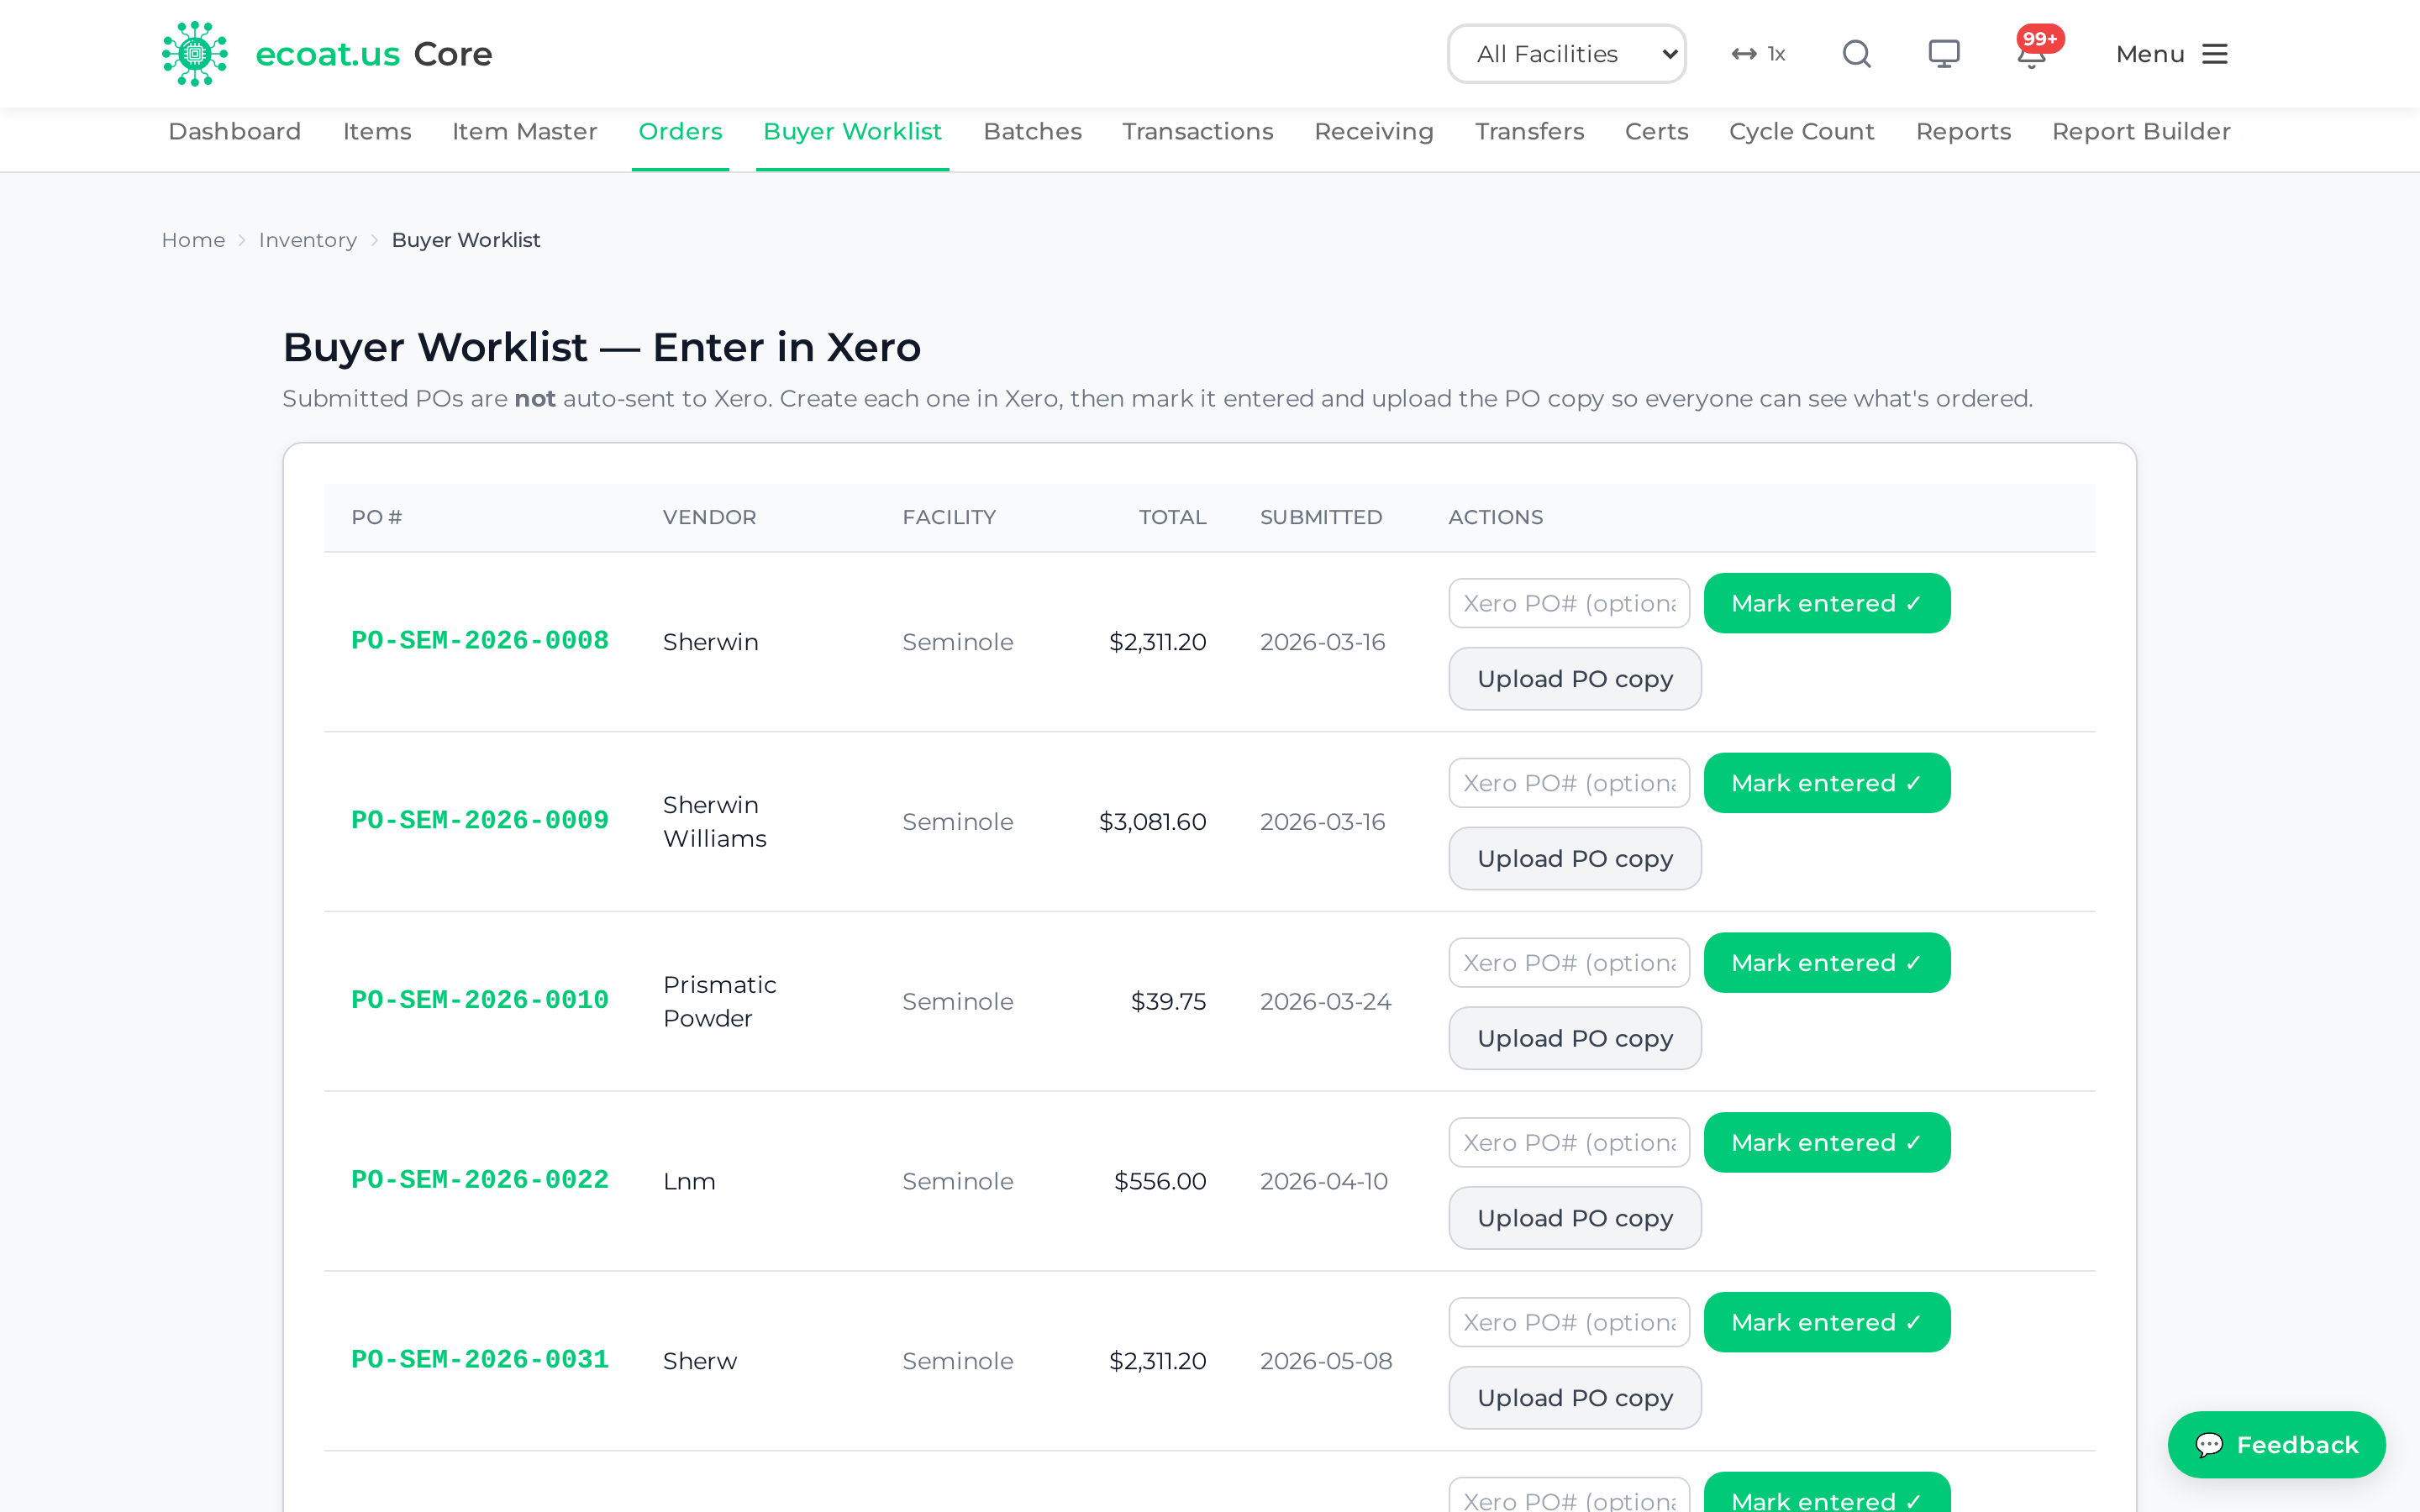
Clear a PO off the worklist
- Open Inventory → Orders ▾ → Buyer Worklist
- For each PO, create the matching Purchase Order in Xero
- Optionally type the Xero PO# into the reference box so both systems cross-reference
- Upload a copy of the PO so everyone can see what was ordered
- Mark it entered — the row disappears from the worklist
When the list is empty you will see "Nothing waiting — all submitted POs have been entered in Xero. ✓"
Tip: Work the Buyer Worklist to zero as part of your daily purchasing routine. An empty worklist means Core and Xero agree.
Receiving
Receiving records incoming shipments and creates the batch records that give you traceability. Open it from Inventory → Orders ▾ → Receiving.
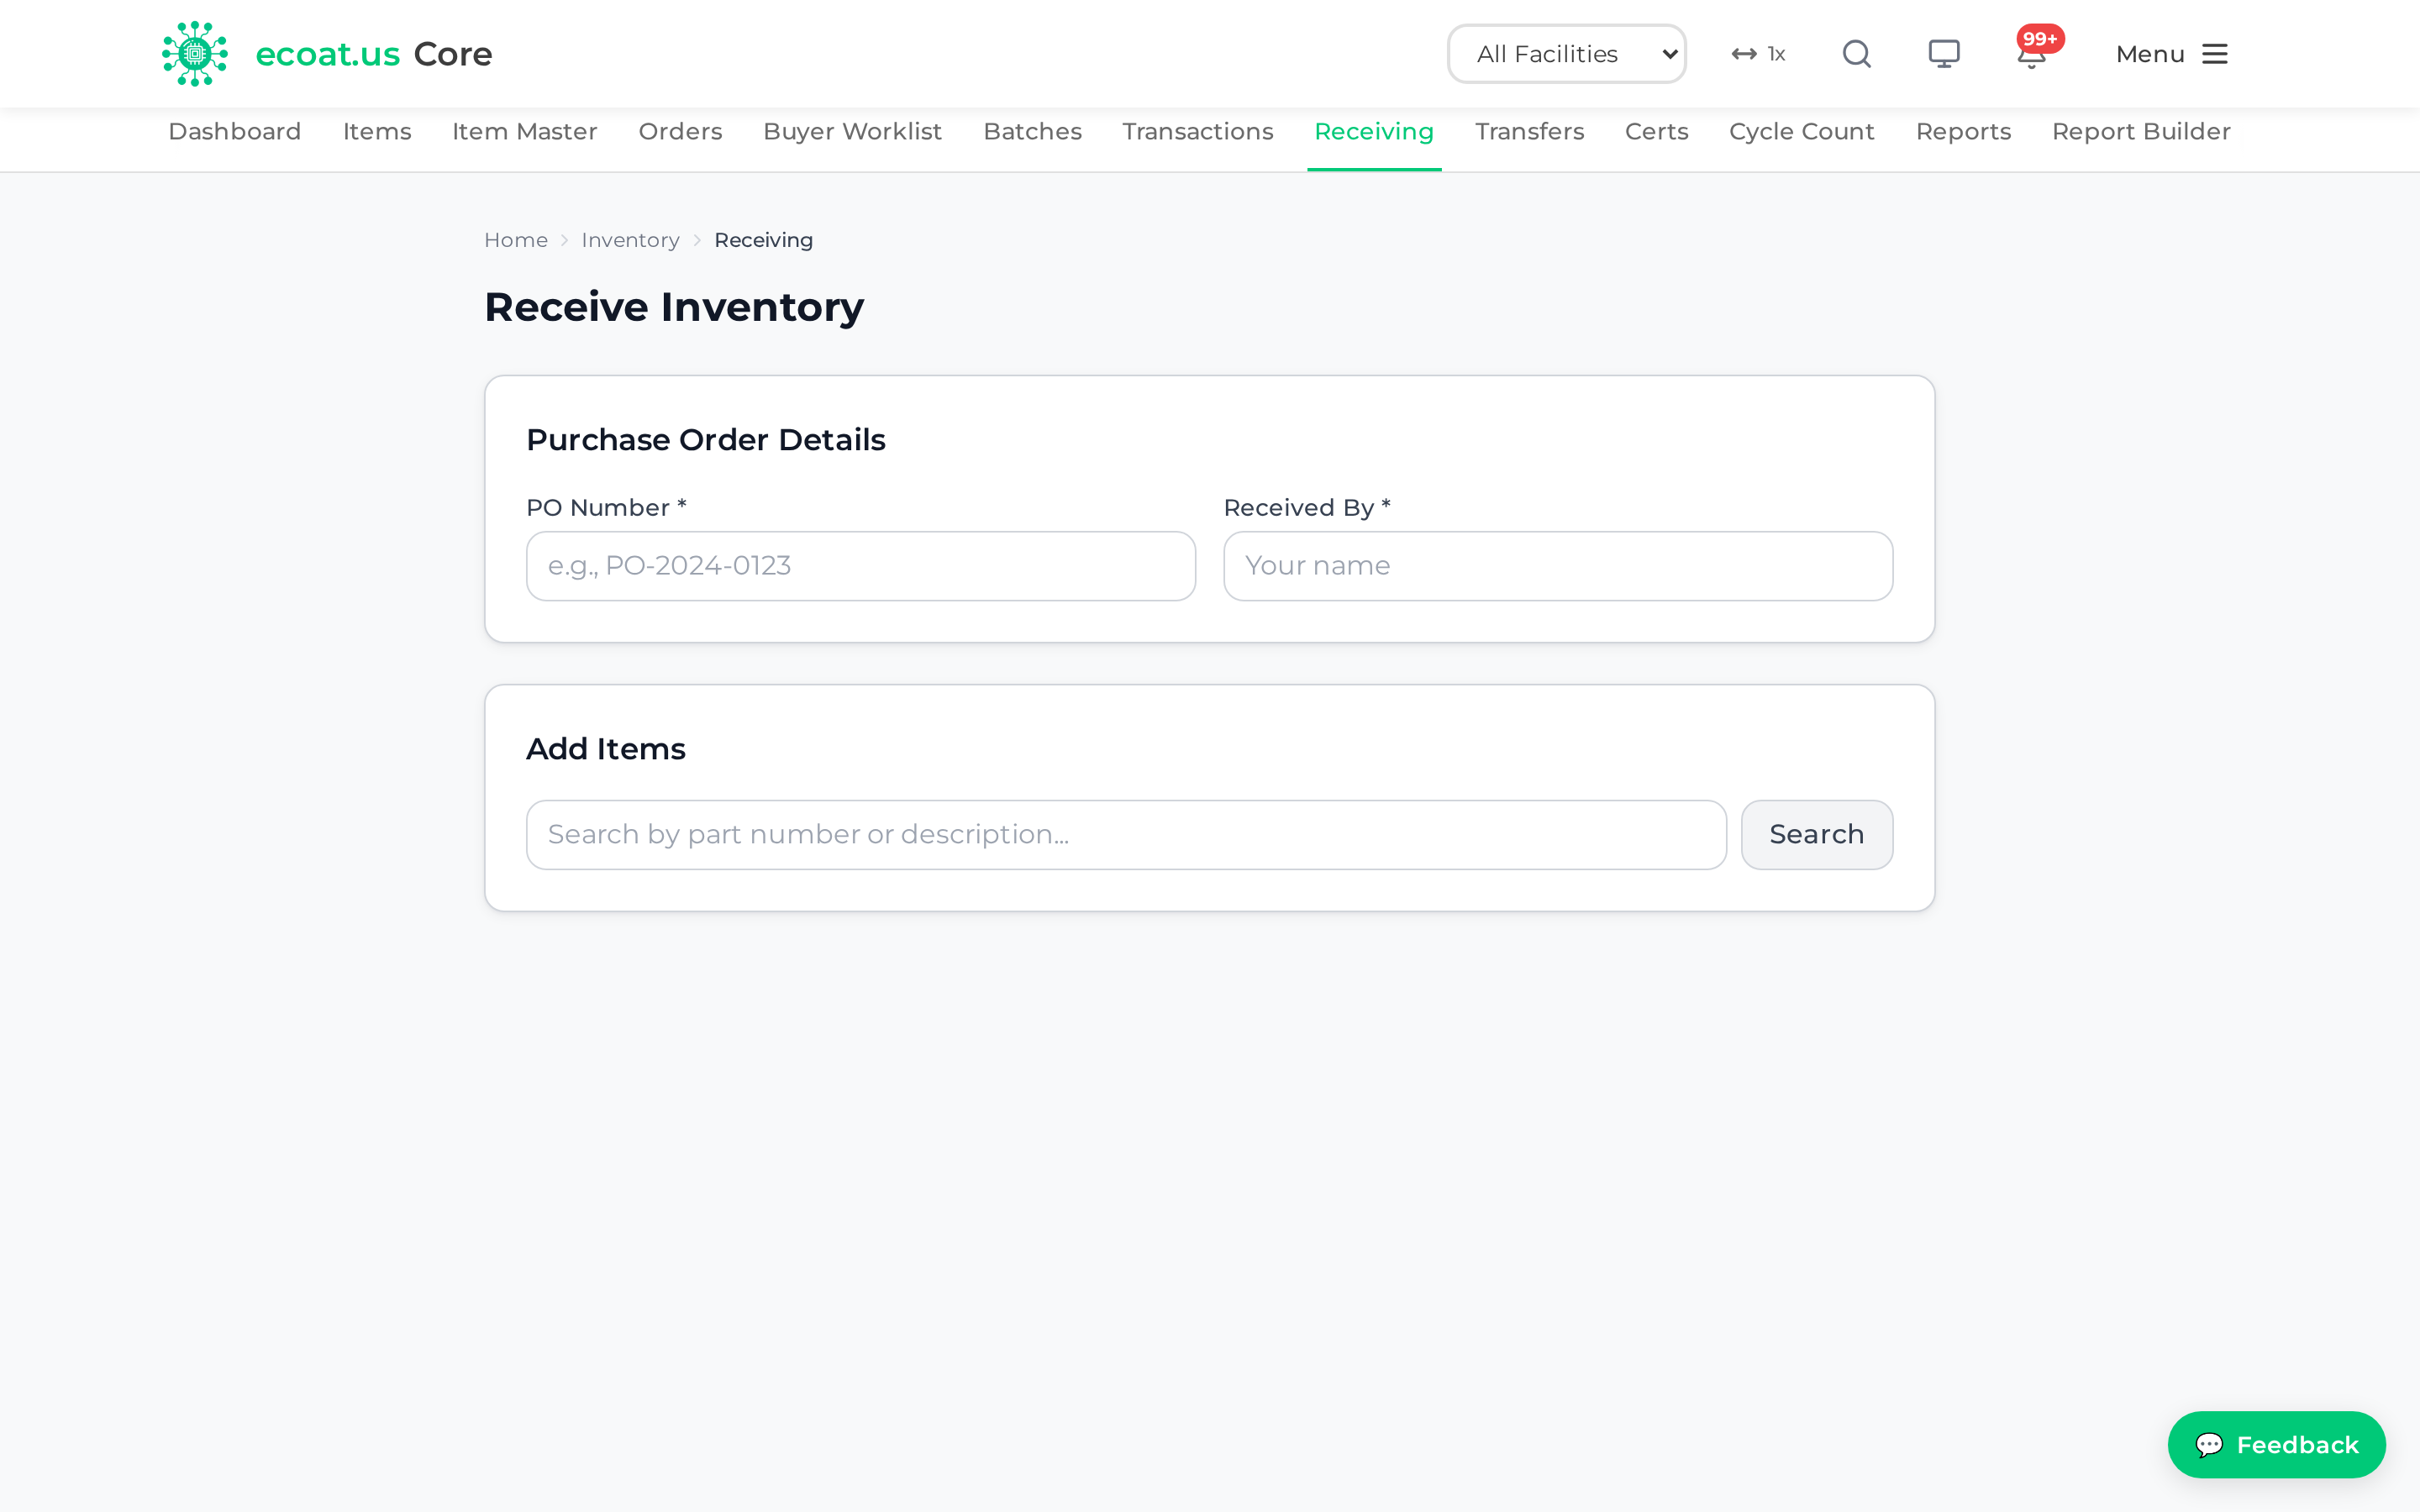
Receive a shipment
- Go to Inventory → Orders ▾ → Receiving
- Enter the PO Number from the packing slip and click Search
- For each item, enter the Quantity received
- Enter the MFG Batch Number from the product label
- Enter the MFG Expiration Date if the label or Certificate of Analysis shows one (optional)
- Click Complete Receiving
You can add the same item more than once to receive different batches with different batch numbers or expiration dates.
About the MFG Batch Number
This is critical for traceability. Find it on the product label (e.g. LOT 123456 or BATCH XYZ789). If it is missing, contact the vendor before receiving.
Certificate check while receiving
Core tracks certificates by vendor + MFG batch/lot number, so you only ever request a cert once per batch:
- Green "Cert on file" — nothing to do; a cert already exists for this vendor + batch
- Amber "Cert needed" — click Register Cert to create the cert record
If a Certificate of Conformance is missing, mark the batch Quarantined until it arrives.
Special cases
- Partial receipt: receive only what physically arrived; the PO stays Partial
- Over-shipment: stop and notify the Materials Manager — do not receive the excess
- Wrong item: stop, take a photo, notify the Materials Manager, set it aside for return
- Customer-supplied (no PO): use a PO number in the format
CUSTOMER-YYYY-NNNand unit cost$0.00
Tip: For Paint items, receiving automatically creates a batch record and prints an optional label (see Batches below) — you don't create the batch by hand.
Batches
A batch is a uniquely identified quantity of material — the backbone of ISO 9001 traceability and expiration control. Open the list from Inventory → Stock ▾ → Batches.
Each batch carries a unique Batch ID (BATCH-YYYY-NNNNNN), the vendor's MFG batch/lot number, quantity, received date, expiration date, PO link, and storage location.
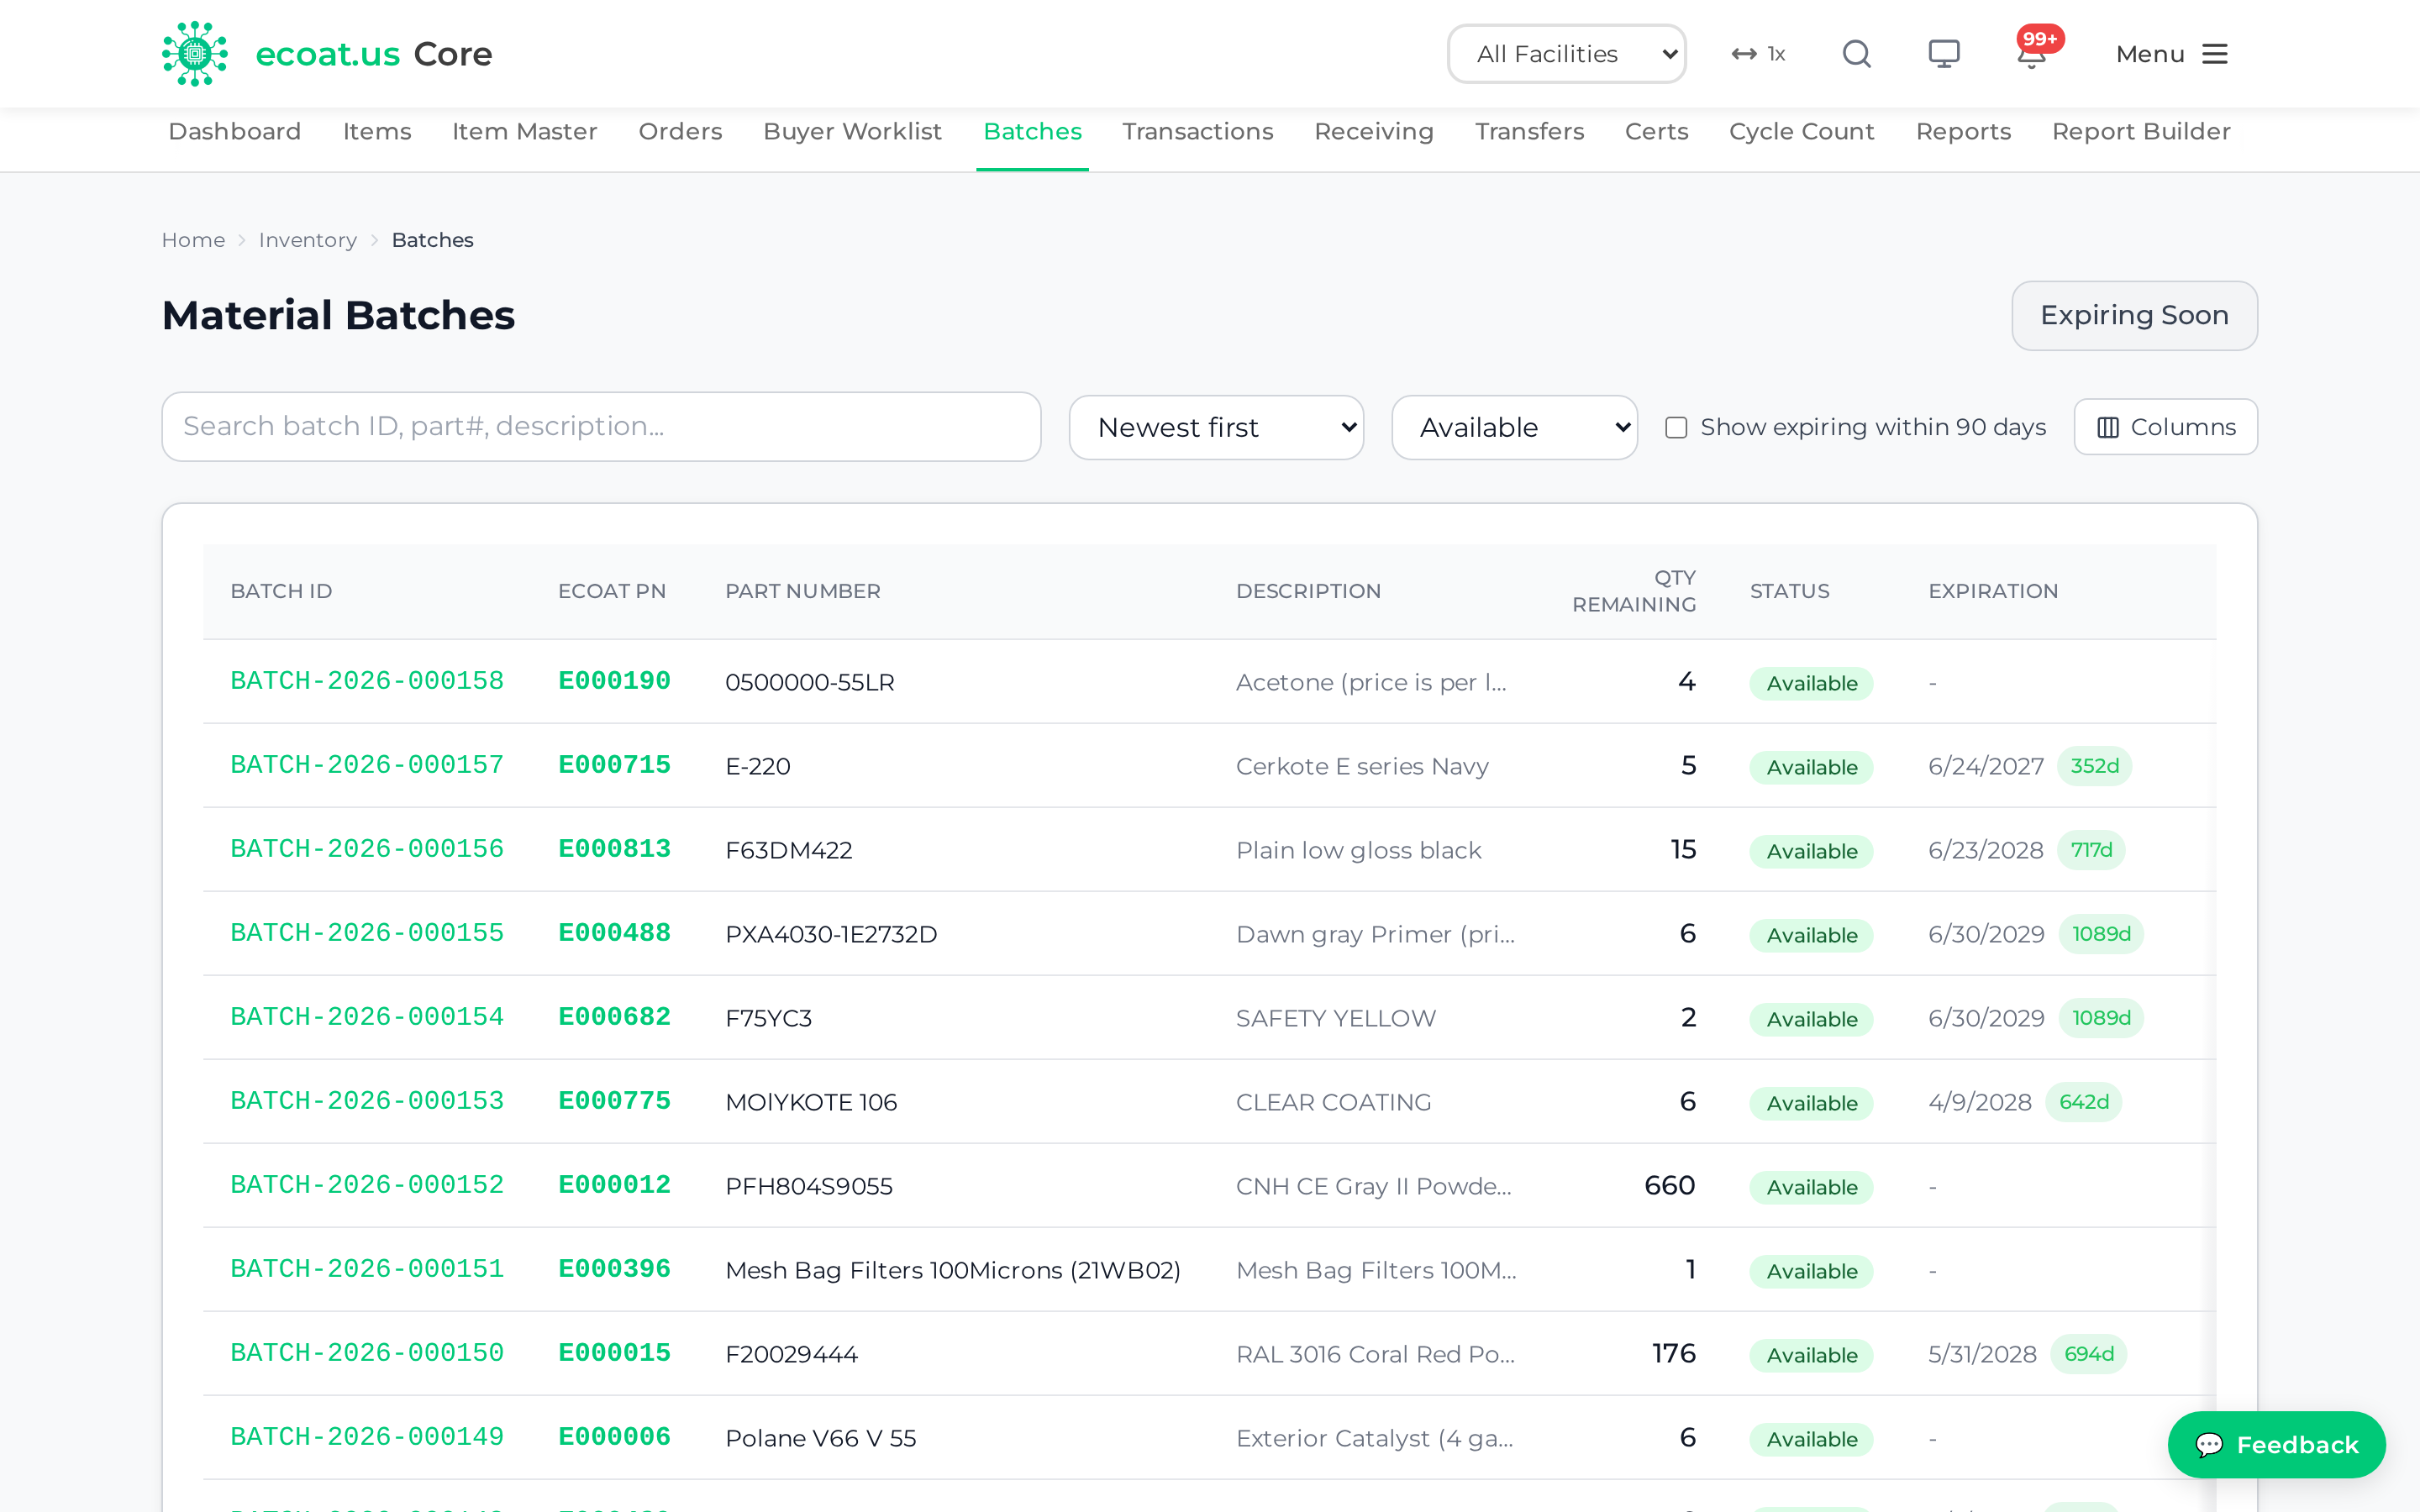
How batches get created (Material Type matters)
You normally don't create batches manually — Receiving does it for you, but only for the right kind of item. When you receive an item whose Material Type is "Paint," Core automatically creates a batch and sets an expiration date (the manufacturer's date if you entered one, otherwise one year from today). Items with any other Material Type are not batch-tracked unless you supply an MFG batch number during receiving.
This is why Material Type is a load-bearing field: it decides whether paint batches and expirations get created at all. If a paint product isn't generating batches, check that its Material Type is set to Paint.
View and filter batches
Go to Inventory → Stock ▾ → Batches and filter by facility, item, status, or "expiring soon" (next 30 days).
Batch statuses:
| Status | Meaning | OK to use? |
|---|---|---|
| Available | Ready for use | Yes |
| In Use | Partially consumed | Yes |
| Depleted | Fully consumed (qty = 0) | No |
| Expired | Past expiration | No — dispose |
| Quarantined | Pending cert / quality hold | No — wait |
Use the oldest stock first (FEFO/FIFO)
The policy is FEFO — First Expired, First Out. Core recommends the batch with the earliest expiration date first. For items without expiration dates it falls back to FIFO (oldest received first). The batch detail shows a "use first" recommendation — pull that batch, and if you use a different one you'll be asked for an override reason.
Check out (issue) material from a batch
When you consume material, record it against the batch so on-hand stays accurate:
- Open a batch and click Checkout
- On the Checkout Material screen, review the Available Quantity
- Under Issue Material, enter the Quantity to Issue
- Submit
If you try to issue from a batch that isn't the FEFO-recommended one, Core flags a FEFO violation and asks you to enter an Override Reason before it will proceed.
Print a batch label
From the batch detail, click Print Label. Labels include a scannable QR code, the Batch ID and MFG batch number, part number and description, expiration date, and location.
Tip: Use the "Expiring Soon" filter daily. Red means under 7 days (use immediately), orange 7–14 days, yellow 14–30 days.
Transactions
The Transactions screen is the audit trail of every inventory movement. Open it from Inventory → Movement ▾ → Transactions.
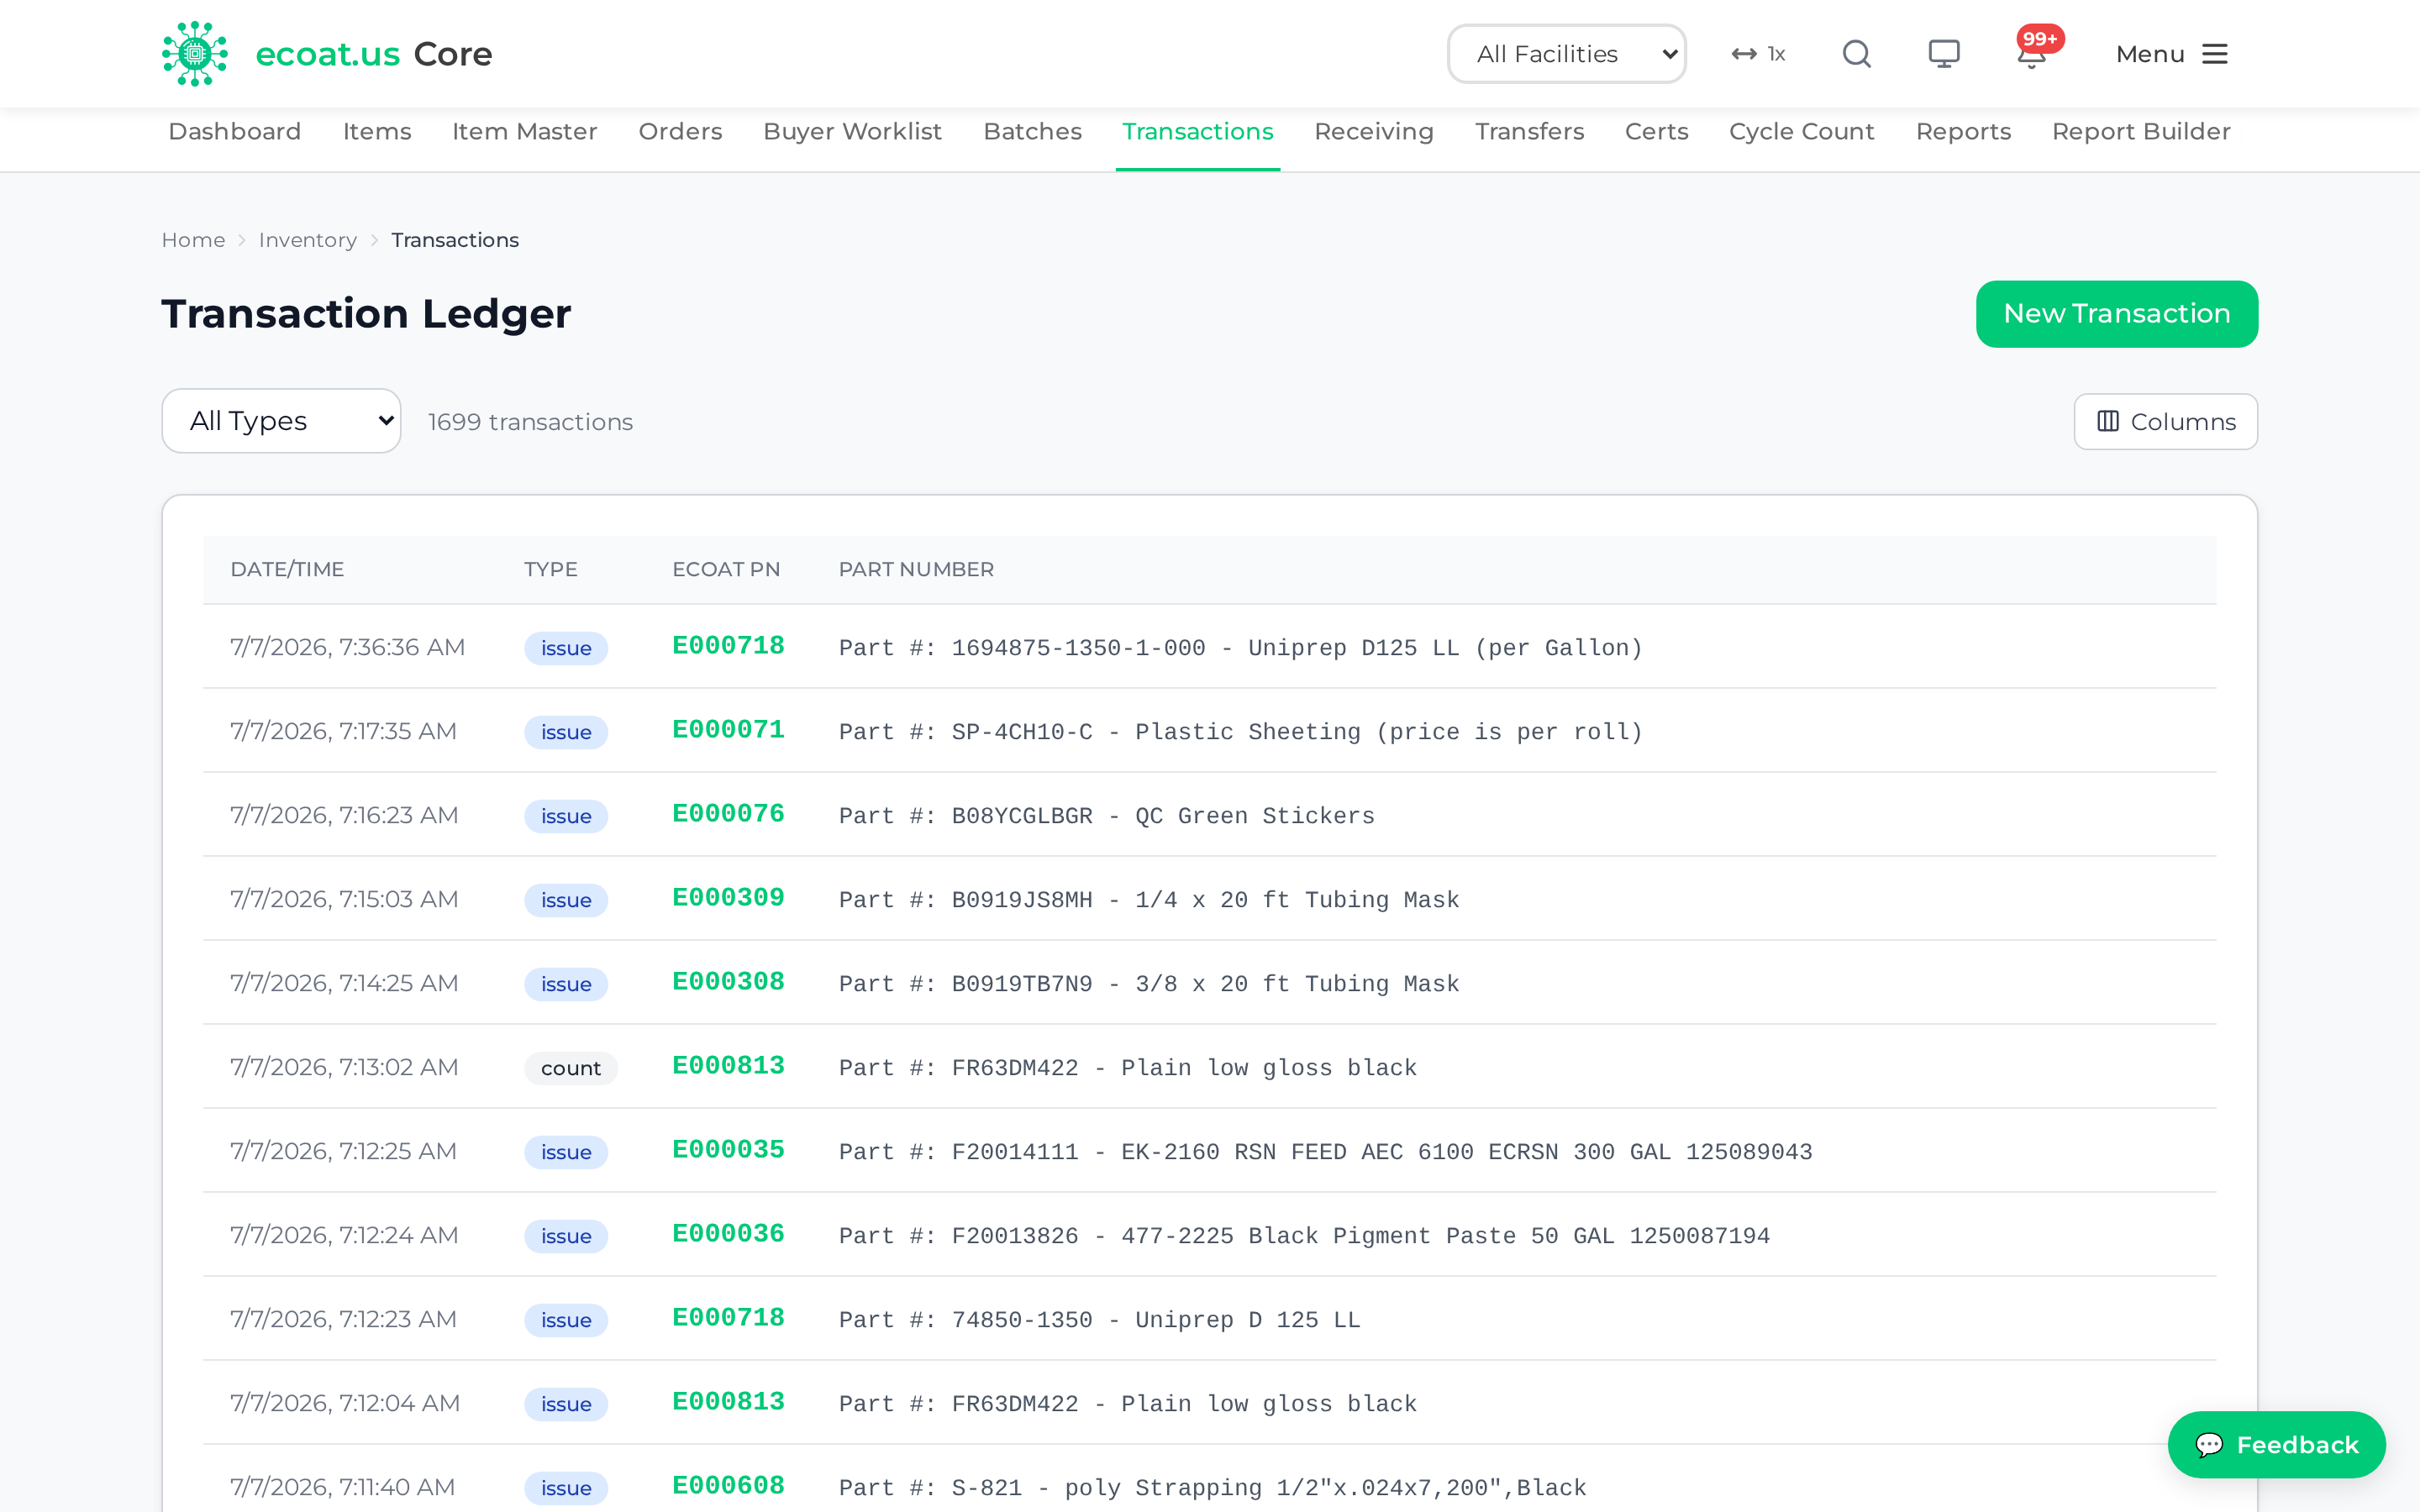
Common transaction types:
| Type | Use when | Quantity effect |
|---|---|---|
| Count | Correcting to a physical count | + or − |
| Adjust | Spill or damage | Usually − |
| Issue | Material used in production | − |
| Transfer | Moved between locations | No net change |
Make an adjustment
The simplest correction is to edit the item directly:
- Go to Inventory → Stock ▾ → Items and open the item
- Click Edit and update the On Hand quantity
- Add a note explaining the change (e.g.
Spill - 2026-07-07 - 2 gal lost - J. Smith) - Save
Permissions: Adjustments above about $1,000 in value should be approved by the Materials Manager before you make them; larger amounts also require CFO notification or approval. When in doubt, investigate the discrepancy before adjusting.
Receiving vs. Transfers
Receiving brings material in from vendors. Transfers move material between ECOAT facilities with a full audit trail. Open the list from Inventory → Movement ▾ → Transfers.
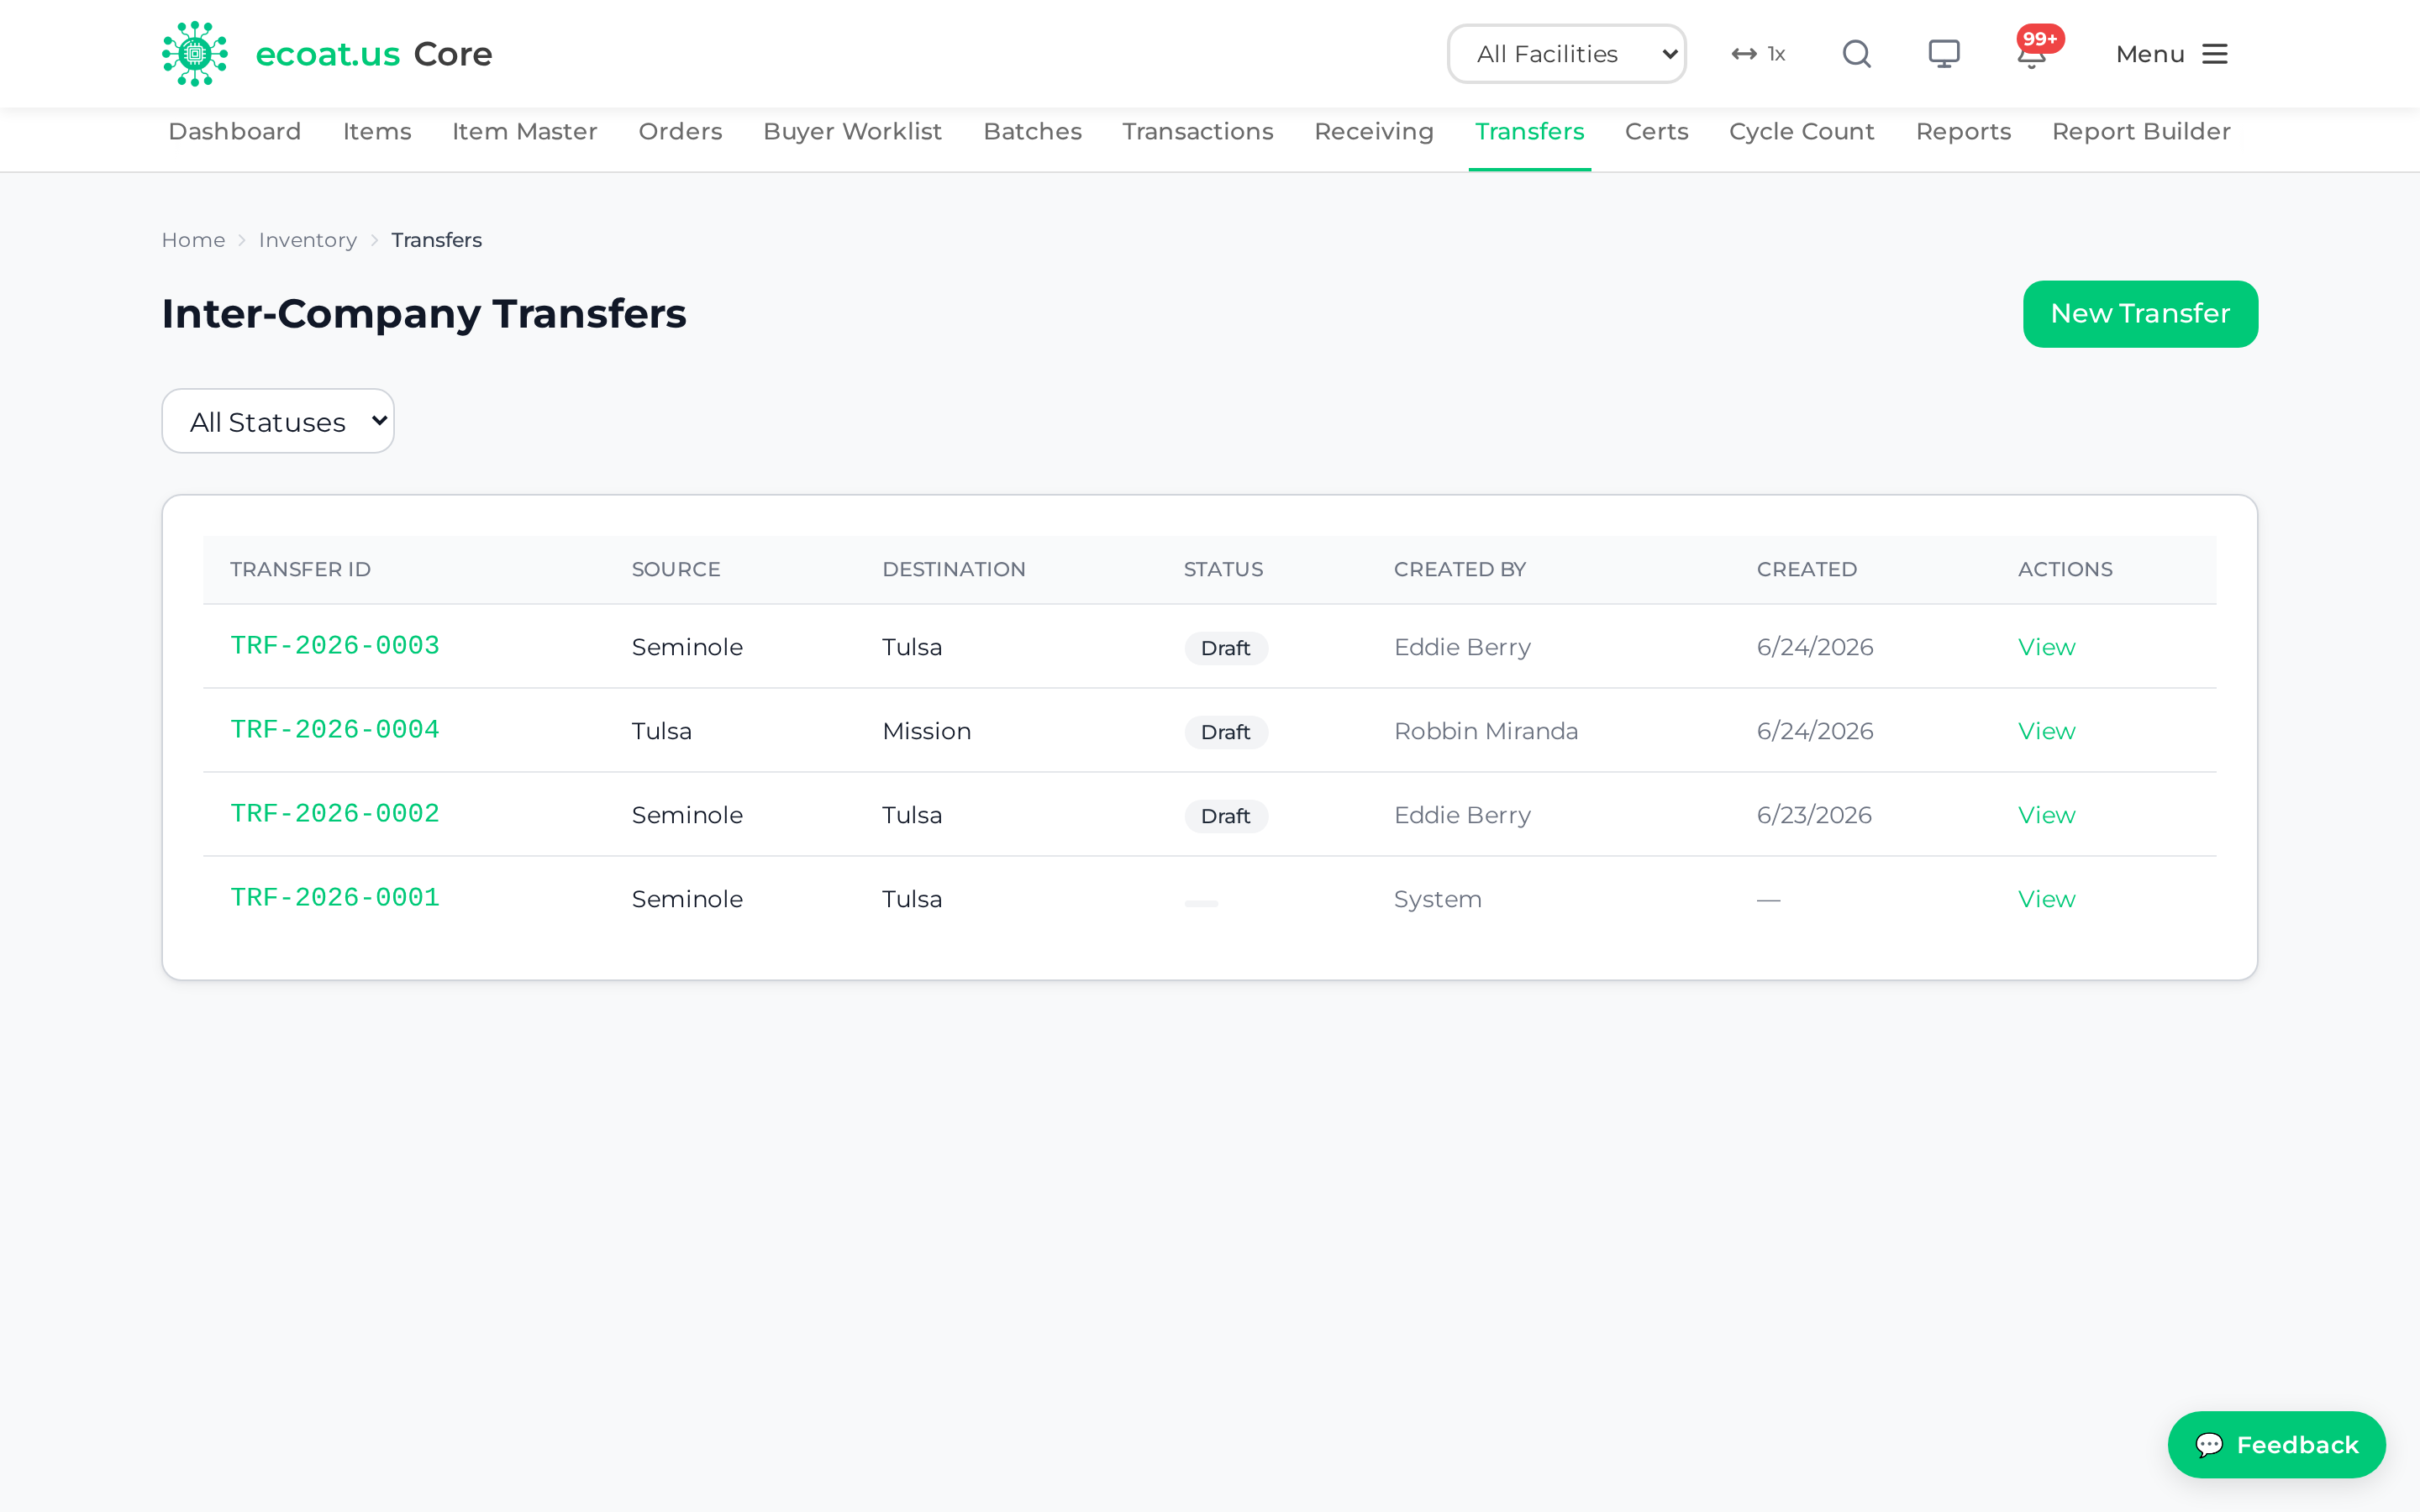
Transfer statuses: Draft → In Transit → Received (or Cancelled while still Draft).
Create, ship, and receive a transfer
- Create: Go to Inventory → Movement ▾ → Transfers and click New Transfer, then pick the Source and Destination facilities, add items with quantities, and click Create Transfer (starts as Draft)
- Ship: Open the Draft and click Ship Transfer — Core verifies stock and deducts inventory from the source immediately, moving it to In Transit
- Receive: Open the In Transit transfer, click Receive Transfer, confirm the quantities, enter your name as Received By, and Complete Receiving — inventory is added to the destination
Tip: Source inventory drops the moment you ship, not when the truck arrives. That is intentional so material in transit isn't double-counted.
Certificate Registry
The Certificate Registry tracks which vendor batches already have certificates (CofC/CofA) on file, so you never request the same cert twice. Open it from Inventory → Stock ▾ → Certs.
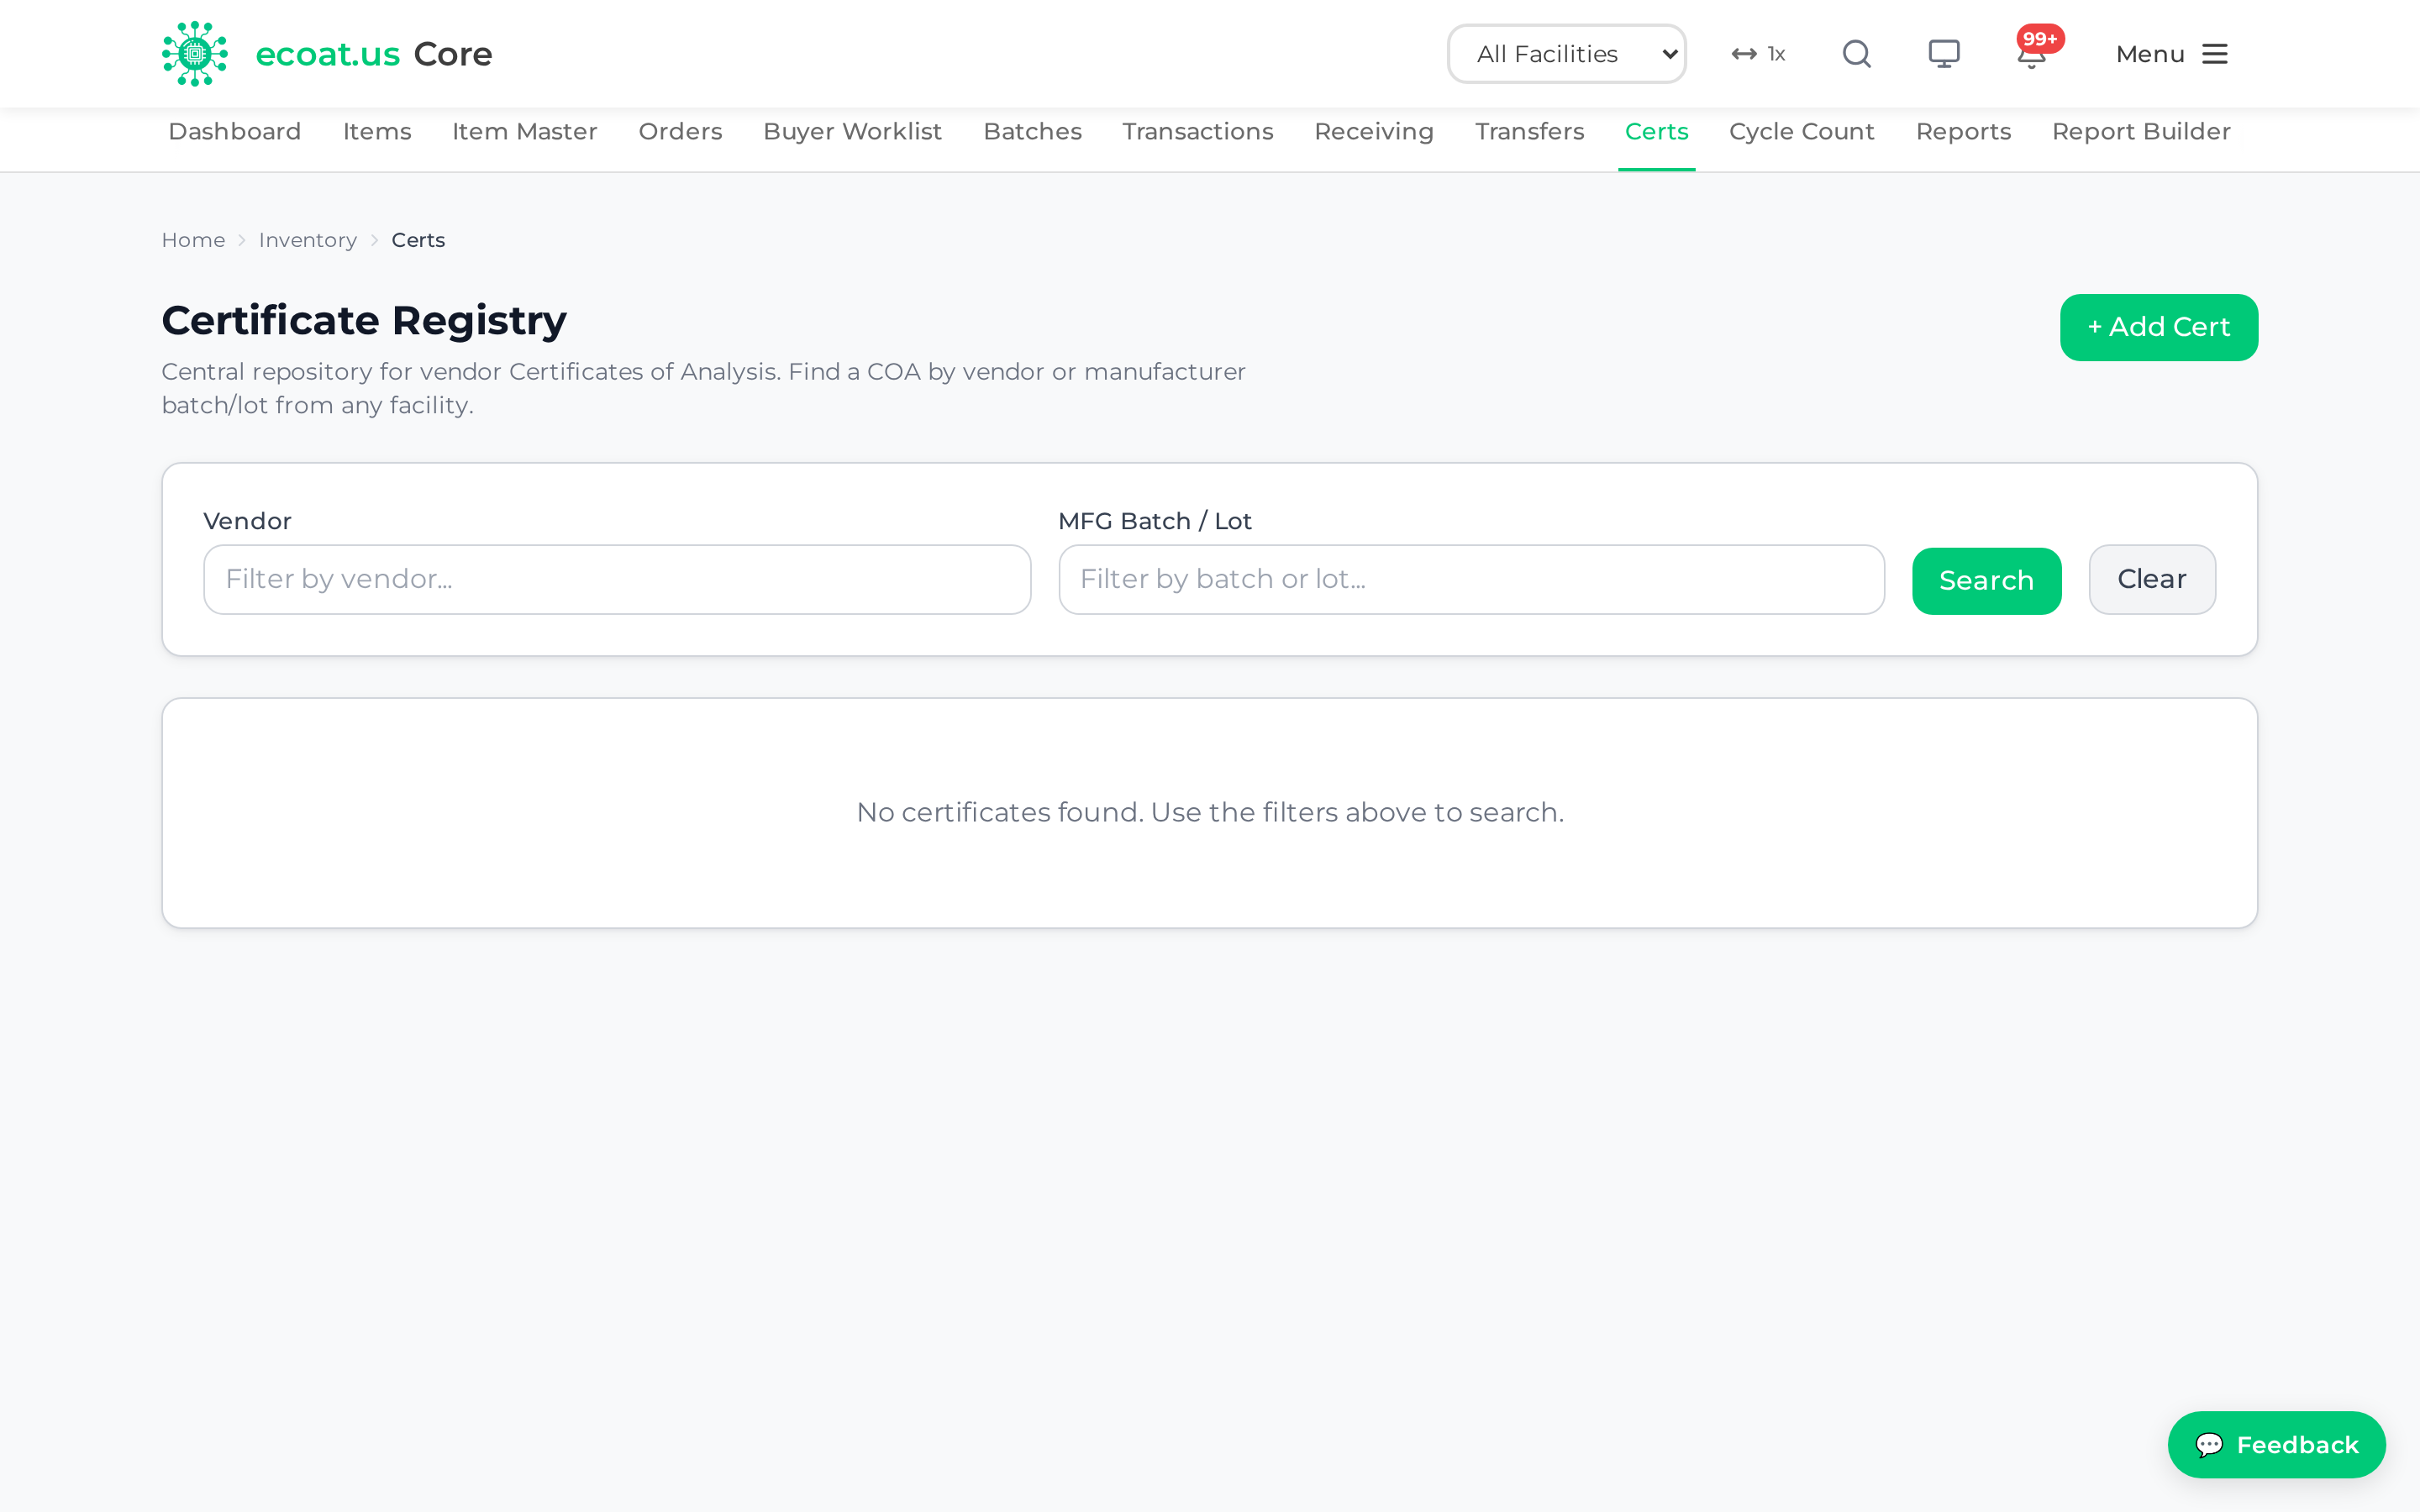
The registry follows the facility selector in the top bar. Pick your plant and you see its certs — plus any older cert not yet tied to a plant, which wears an Unassigned chip and shows up at every facility so it's never lost. Pick All Facilities to see everything at once.
Search by vendor name or MFG batch/lot number. Each record shows the Cert ID, vendor, batch/lot, facility, status (Active or Superseded), who uploaded it, and when. Certs are usually registered during Receiving (via the Register Cert button), and + Add Cert files one directly — vendor, MFG batch/lot, and the COA file (PDF or scan) are required, and the cert lands under the facility selected in the top bar. If a cert's file didn't make it up, its row shows an amber Upload COA button to fix it in place.
Cycle Count
Cycle counting keeps inventory accurate by counting a slice of items regularly, without shutting operations down. Open it from Inventory → Movement ▾ → Cycle Count.
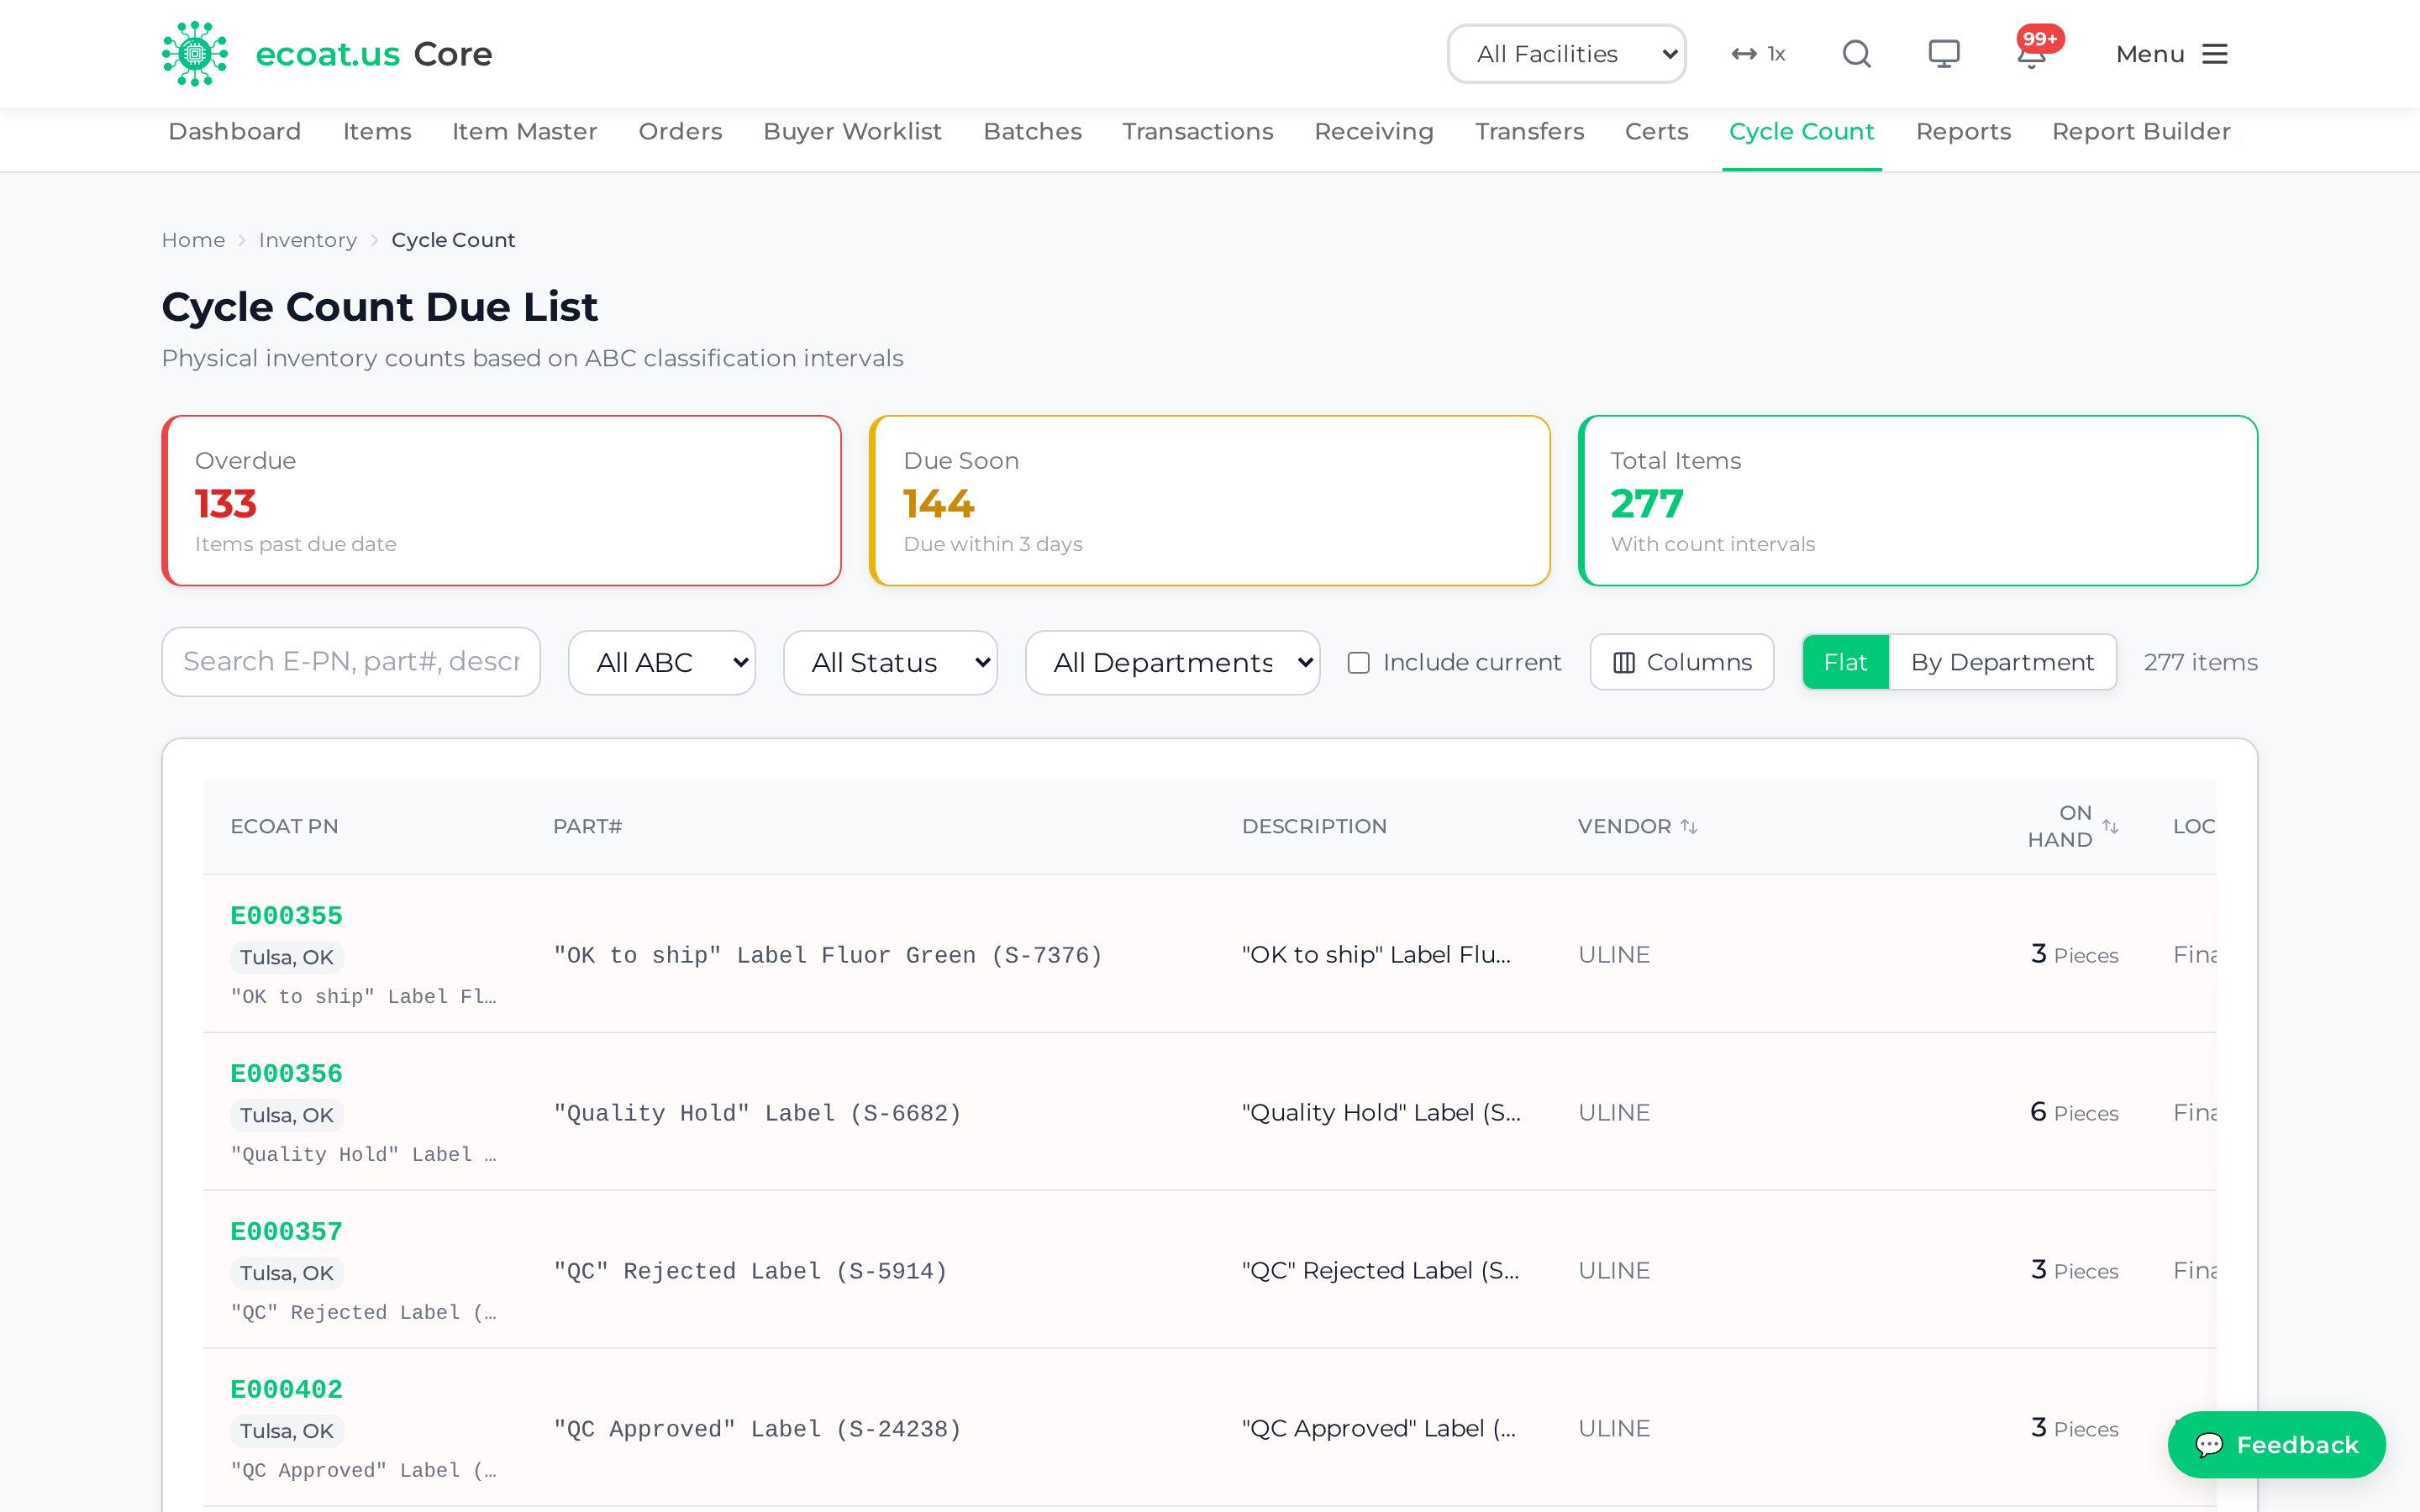
Items are scheduled by their ABC classification and inventory interval — Class A (critical) counted most often, Class C least often. Each row shows the item's facility badge and manufacturer part number alongside a color-coded due status: red (overdue), yellow (due soon, within 3 days), green (current).
Record a count
- Go to Inventory → Movement ▾ → Cycle Count
- Narrow the list with the filter bar — search text, ABC class, status, or "include current"
- Click an item row to open the Record Count modal
- Physically count the item and enter the Counted Quantity
- Core shows the variance versus on-hand; if it exceeds the ABC threshold you'll see a warning
- Add a note explaining any variance and click Submit Count
Submitting creates a COUNT transaction, updates on-hand, stamps the last-count date, and moves the item to "Current."
Variance thresholds: Class A < 2%, Class B < 5%, Class C < 10%.
Permissions: Purchasing and Admin users see an Edit button on each row to clean up item master data (reorder points, vendor, location) while counting.
Facility Contacts
Facility Contacts is the list of who finishes setting up a new item at each plant. When an item is created at a facility it arrives without a GL code, reorder point, or location — only someone at that plant can fill those in, and this list decides who gets told.
There is one contact role per facility (item setup) for Seminole, Tulsa, Cleveland, and Mission. Enter the person's email and name for a facility and save; Core emails them whenever a new item lands there. If a facility has no contact, Core instead warns the purchasing group once that new items at that plant will notify nobody.
Finding this screen: Facility Contacts has no entry in the Inventory menu. Reach it by typing the address directly — core.ecoat.us/inventory/facility-contacts — or by clicking through from the "No item-setup contact for (facility)" notification, which links straight to it.
Permissions: Anyone with Inventory or Purchasing access can edit the contacts — deliberately, since the people who own item setup are the people who should say who owns it.
Reports
The Reports hub collects the standard inventory reports plus the custom Report Builder. Open it from Inventory → Reports ▾ → Reports.
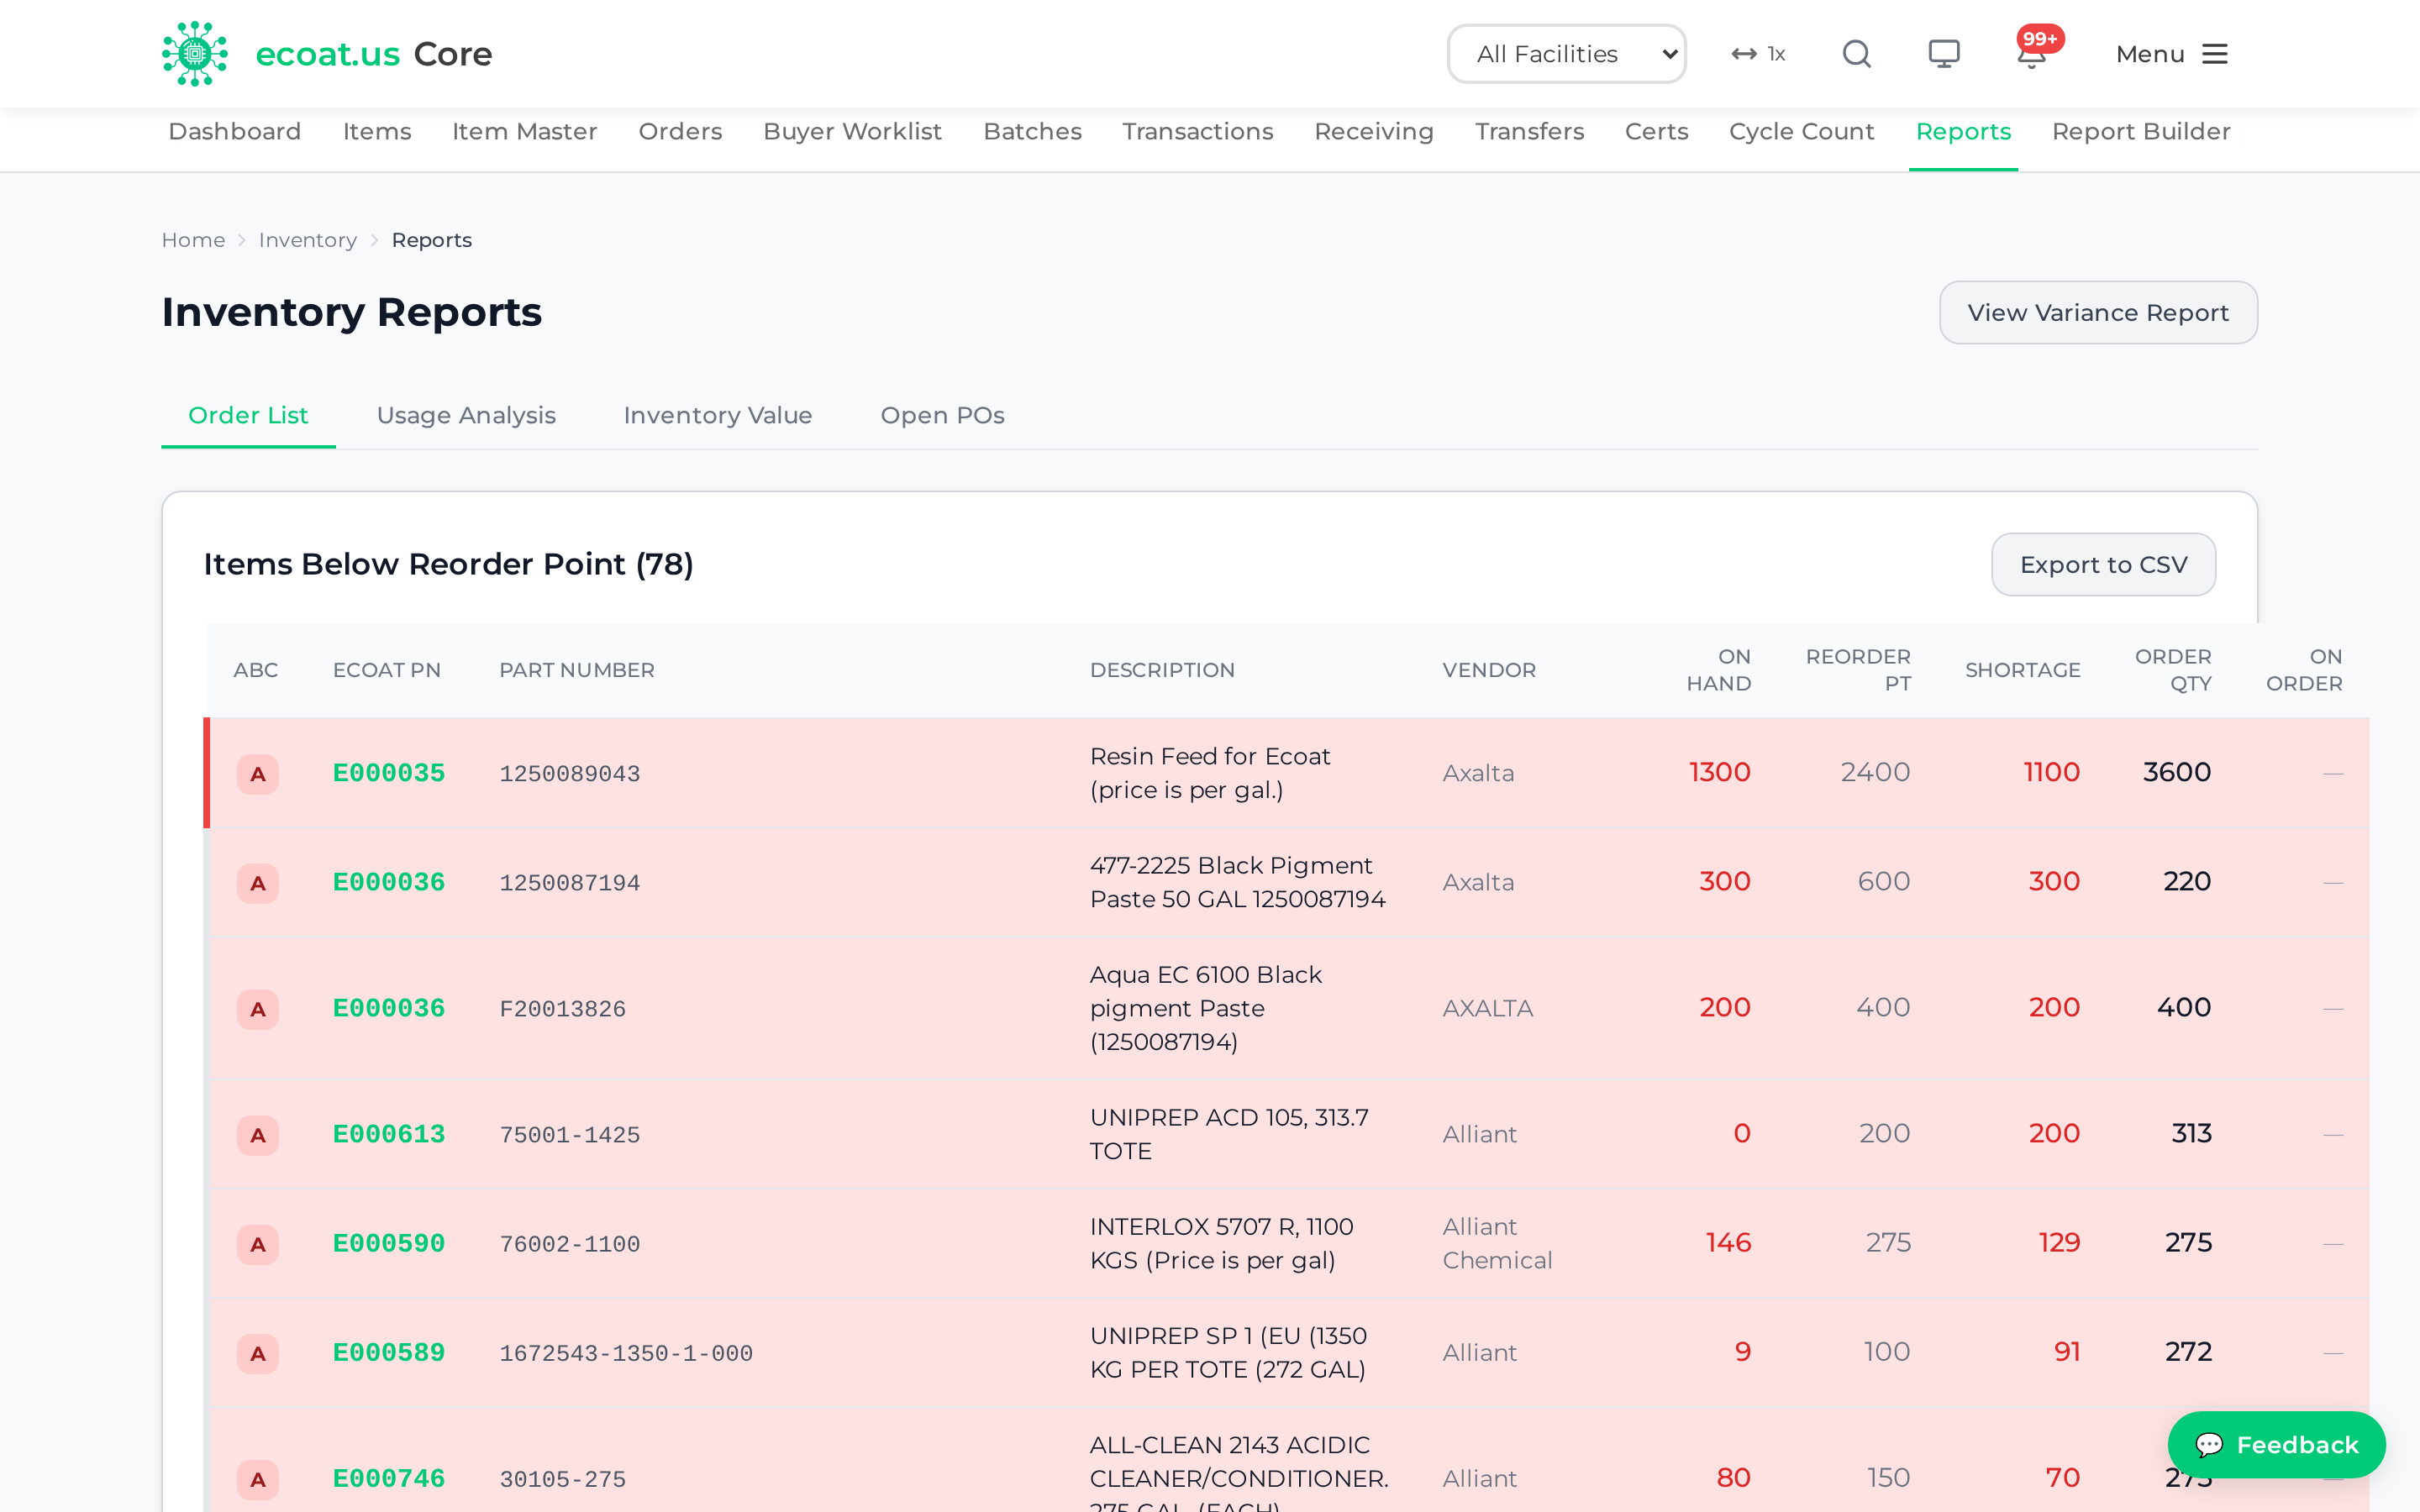
From here you can reach:
- Order List / Low Stock — every item where on-hand ≤ reorder point, color-coded by urgency (red = out of stock, orange = below 50% of reorder point, yellow = at or below reorder point). Filter by facility, page through results, and Export to CSV. Quick actions let you jump to Receiving, bulk-create a PO, or view the item.
- Variance Report — discrepancies found during cycle counts (see below)
- Report Builder — build your own custom report (see below)
Variance Report
Open it from Inventory → Reports ▾ → Reports, then click Variance Report. Summary cards show Total Counts, Over, Short, Exact Match, Alerts, and Total Variance for the period. Filter by date range and minimum variance percentage, and Export CSV for analysis in Excel. High-variance rows are highlighted.
Report Builder
Report Builder lets you build your own report from live Core data — pick a dataset, choose columns, filter, group, and export. Open it from Inventory → Reports ▾ → Report Builder.
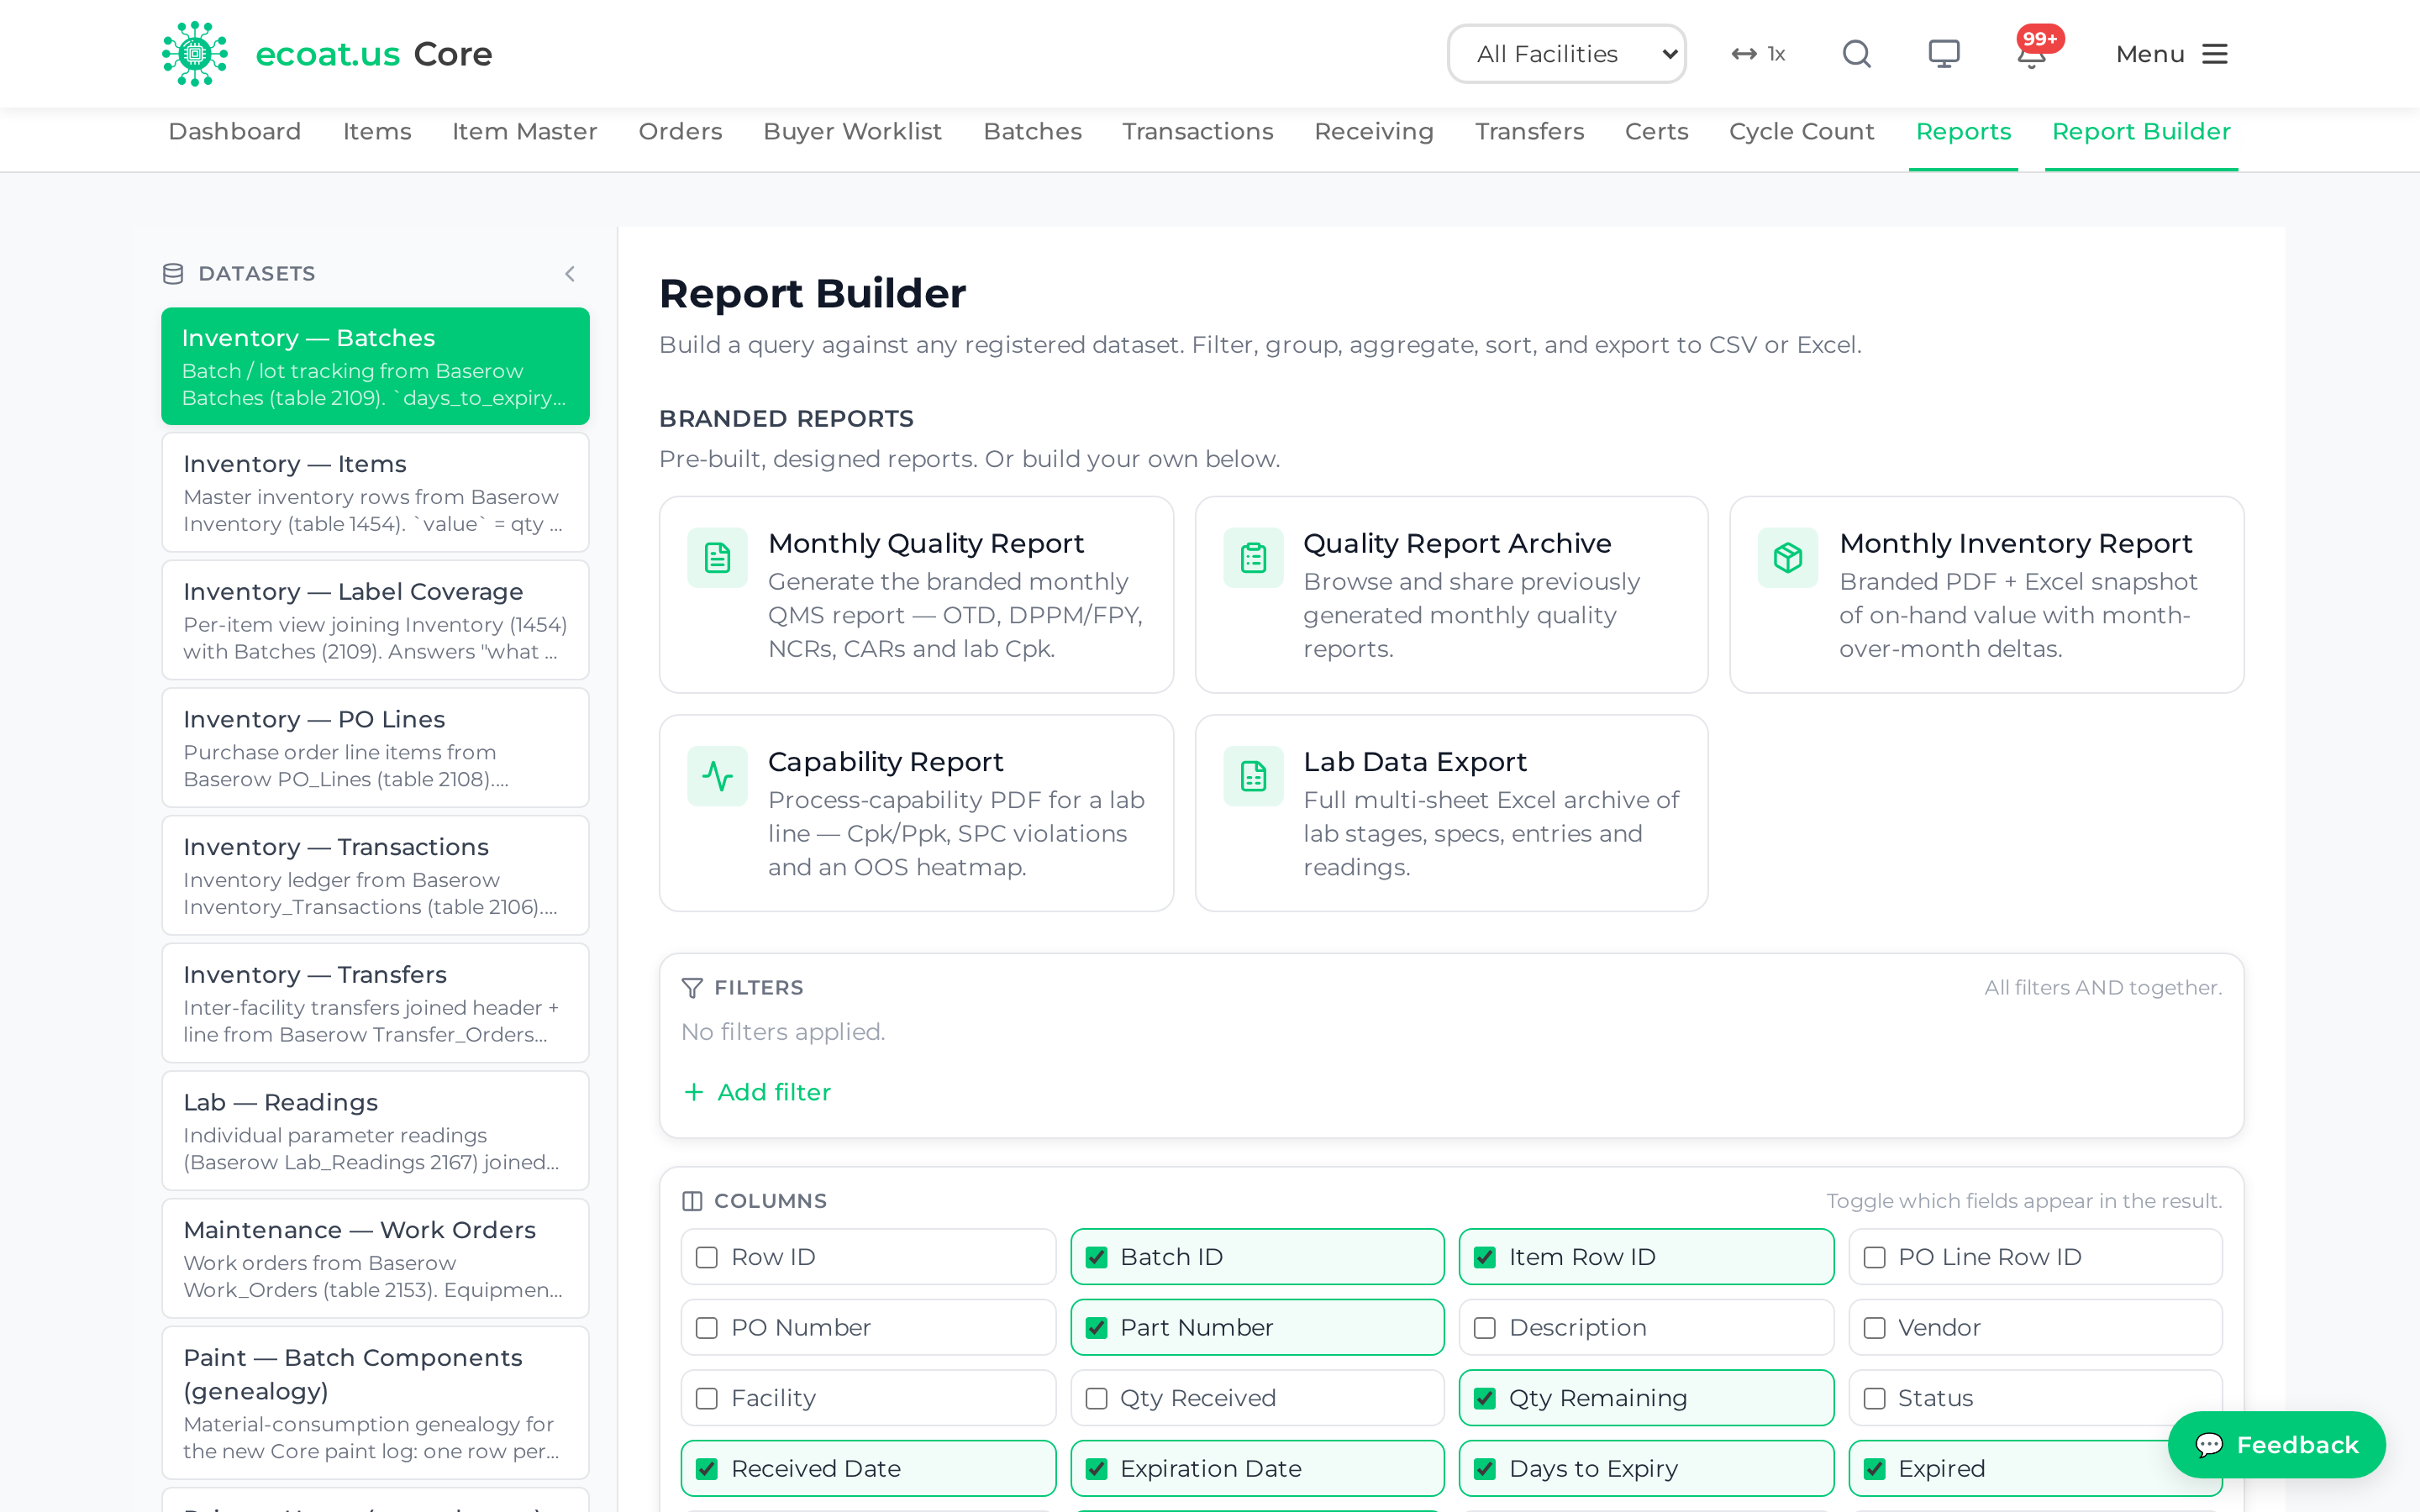
Build a report
- Go to Inventory → Reports ▾ → Report Builder
- Pick a dataset (your data source — see the list below)
- Choose the columns you want and add filters to narrow the rows
- Optionally group by a column and add an aggregation (sum, count, etc.) to summarize
- Review the results table
- Export as CSV, XLSX, or PDF — or save the report to reuse it
Datasets you can report on
Report Builder reads from a shared library of datasets across the whole system, not just inventory:
| Dataset | What it covers |
|---|---|
| Inventory — Items | Item master and on-hand levels |
| Inventory — Batches | Batch records and expirations |
| Inventory — Transactions | Every inventory movement |
| Inventory — Transfers | Inter-facility transfer lines |
| Inventory — PO Lines | Purchase order line items |
| Inventory — Label Coverage | Which items have labels printed |
| Production — Lots | Production lots |
| Production — OTD (On-Time Delivery) | One row per lot with the on-time/late verdict, sliceable by facility, customer, and month |
| Lab — Readings | Lab test readings |
| Paint — Usage | Paint consumption (new + legacy) |
| Paint — Batch Components | Paint batch genealogy |
| Maintenance — Work Orders | Maintenance work orders |
| QMS — CARs | Corrective action requests |
| QMS — NCRs | Non-conformance reports |
| Safety — PPE Observations | Safety observation records |
| ZNET — Production Runs | E-coat production runs |
| ZNET — Anode Health | Anode health tracking |
Tip: The Production — OTD dataset is the one to use for delivery-performance reporting. It carries the same on-time logic the production screens use (a lot is on-time if it finished by its due date; internal lots and lots on QC Hold are excluded), so your numbers match the live dashboards.
Charts
Report Builder charts your results automatically when you group by a single column and add a numeric aggregation. If you group by a date column you get a line chart; otherwise you get a bar chart. Without grouping, you simply get the results table. There is no separate "pick a chart type" step — grouping is what turns the table into a chart.
Save, share, and schedule
- Save a report to reuse its dataset, columns, filters, and grouping later
- Share a saved report so colleagues can open it
- Subscribe to have a saved report emailed on a schedule — daily, weekly, monthly, or quarterly — as PDF, XLSX, or CSV
Permissions: If you don't see any datasets, you may not have access — check with IT. Saved reports you mark as shared become visible to other users.
Lab
Lab
The Lab module is where technicians record chemical test readings for each processing line, watch bath conditions in real time, and prove the process stays in control. It turns shift-by-shift measurements into out-of-spec alerts, SPC control charts, and audit-ready capability reports.
The Lab tab bar keeps Dashboard and Monitor on their own and groups the rest into three dropdowns — Entries ▾ (New Entry, Entries), Analysis ▾ (SPC Analysis, Capability Reports, Mech Checklist), and ⚙ Configure ▾ (Stages, Specs, Add → Inventory, Report Subscriptions, Mech Templates). Paths below are written as Lab → Entries ▾ → New Entry: click the module, open the dropdown, pick the screen.
Like the rest of Core, Lab respects the facility selector in the top-right corner — set it to your plant so lines, stages, and specs match where you work.
Permissions: Any technician can start entries, view the dashboard, monitor, and SPC charts. Generating formal Capability Reports and all of the configuration pages (Stages, Specs, Add → Inventory, Report Subscriptions, and Mech Templates) are limited to lab supervisors, lab admins, and IT.
Lab Dashboard
The dashboard is your overview of testing activity for the selected facility. Open it from Lab in the main menu (it is the default view).
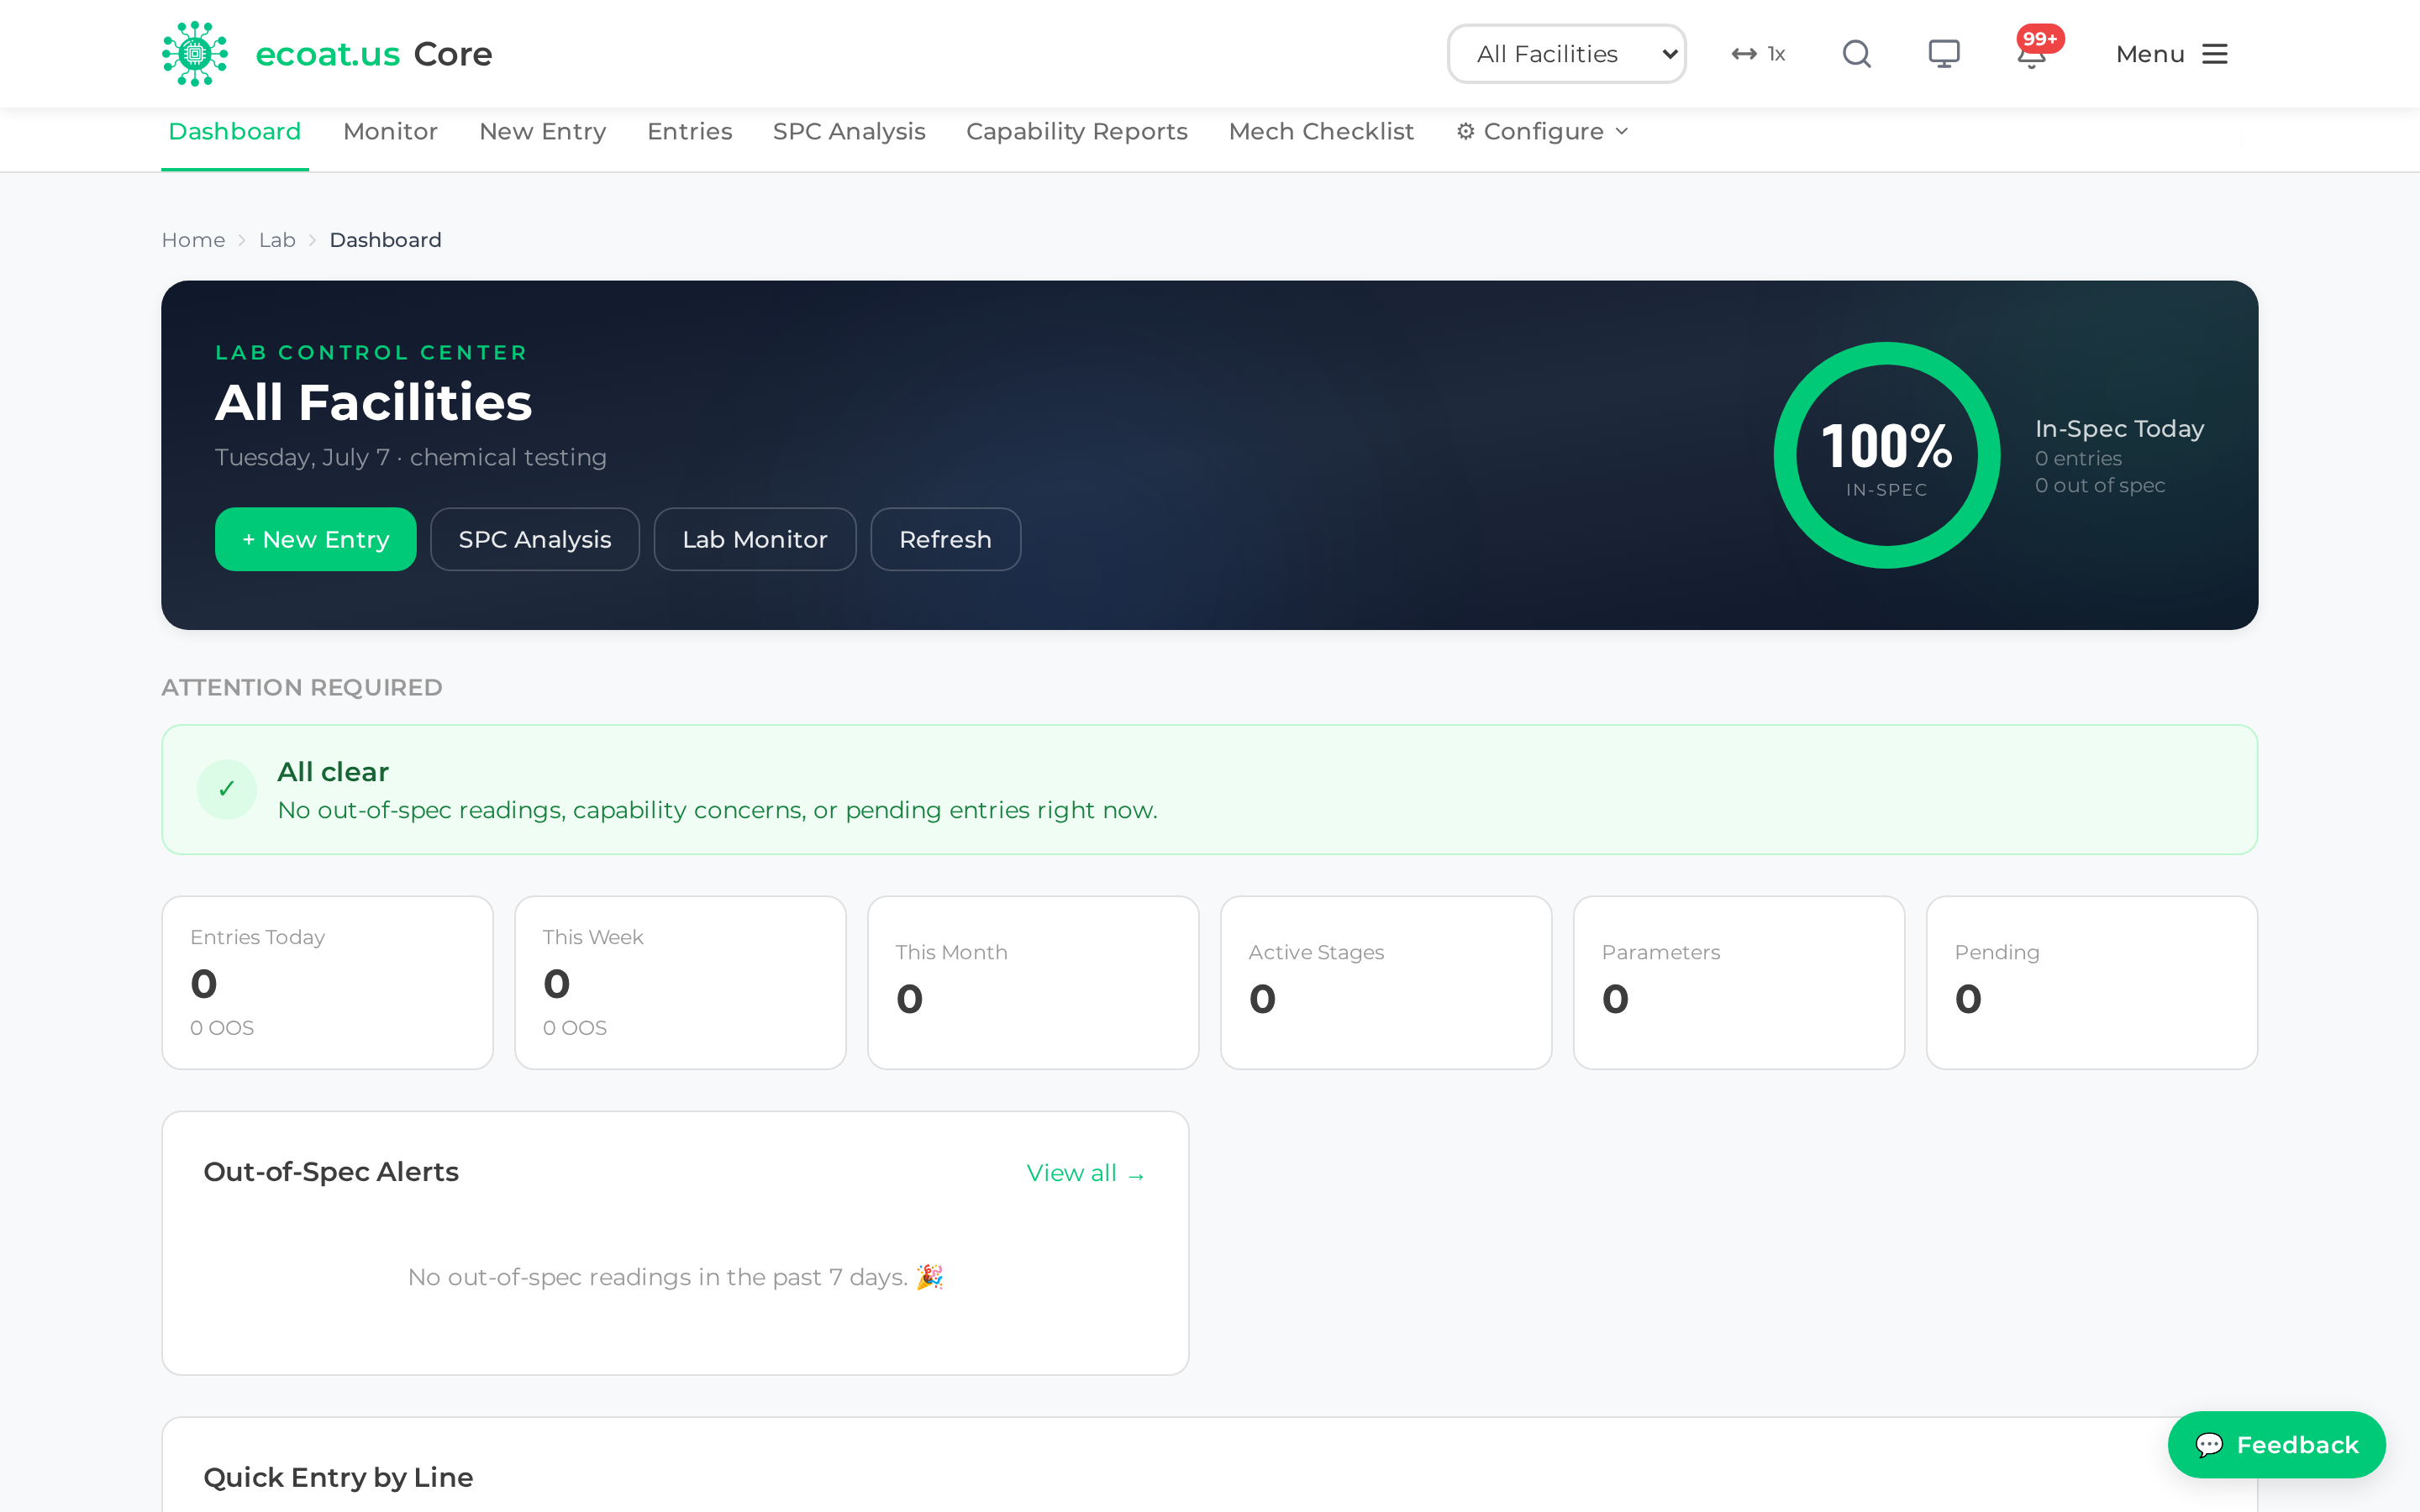
At a glance it shows entry counts (today, this week, this month), pending drafts, how many specs are configured, and out-of-spec counts for today and the week. A Quick Entry by Line section lets you start a new entry pre-set to a line, and a Recent Entries table lists the last 10 with status and out-of-spec (OOS) badges. An SPC Health Summary rates each parameter as Capable (Cpk ≥ 1.33), Marginal (1.0–1.33), or Not Capable (< 1.0).
Tip: Investigate the "Out-of-Spec Highlights" (readings from the past 7 days outside limits) promptly — they are your earliest warning of a process drifting.
Monitor
Lab Monitor is a full-screen, live gauge display built for shop-floor TVs. Open it from Lab → Monitor, or click Lab Monitor on the dashboard.
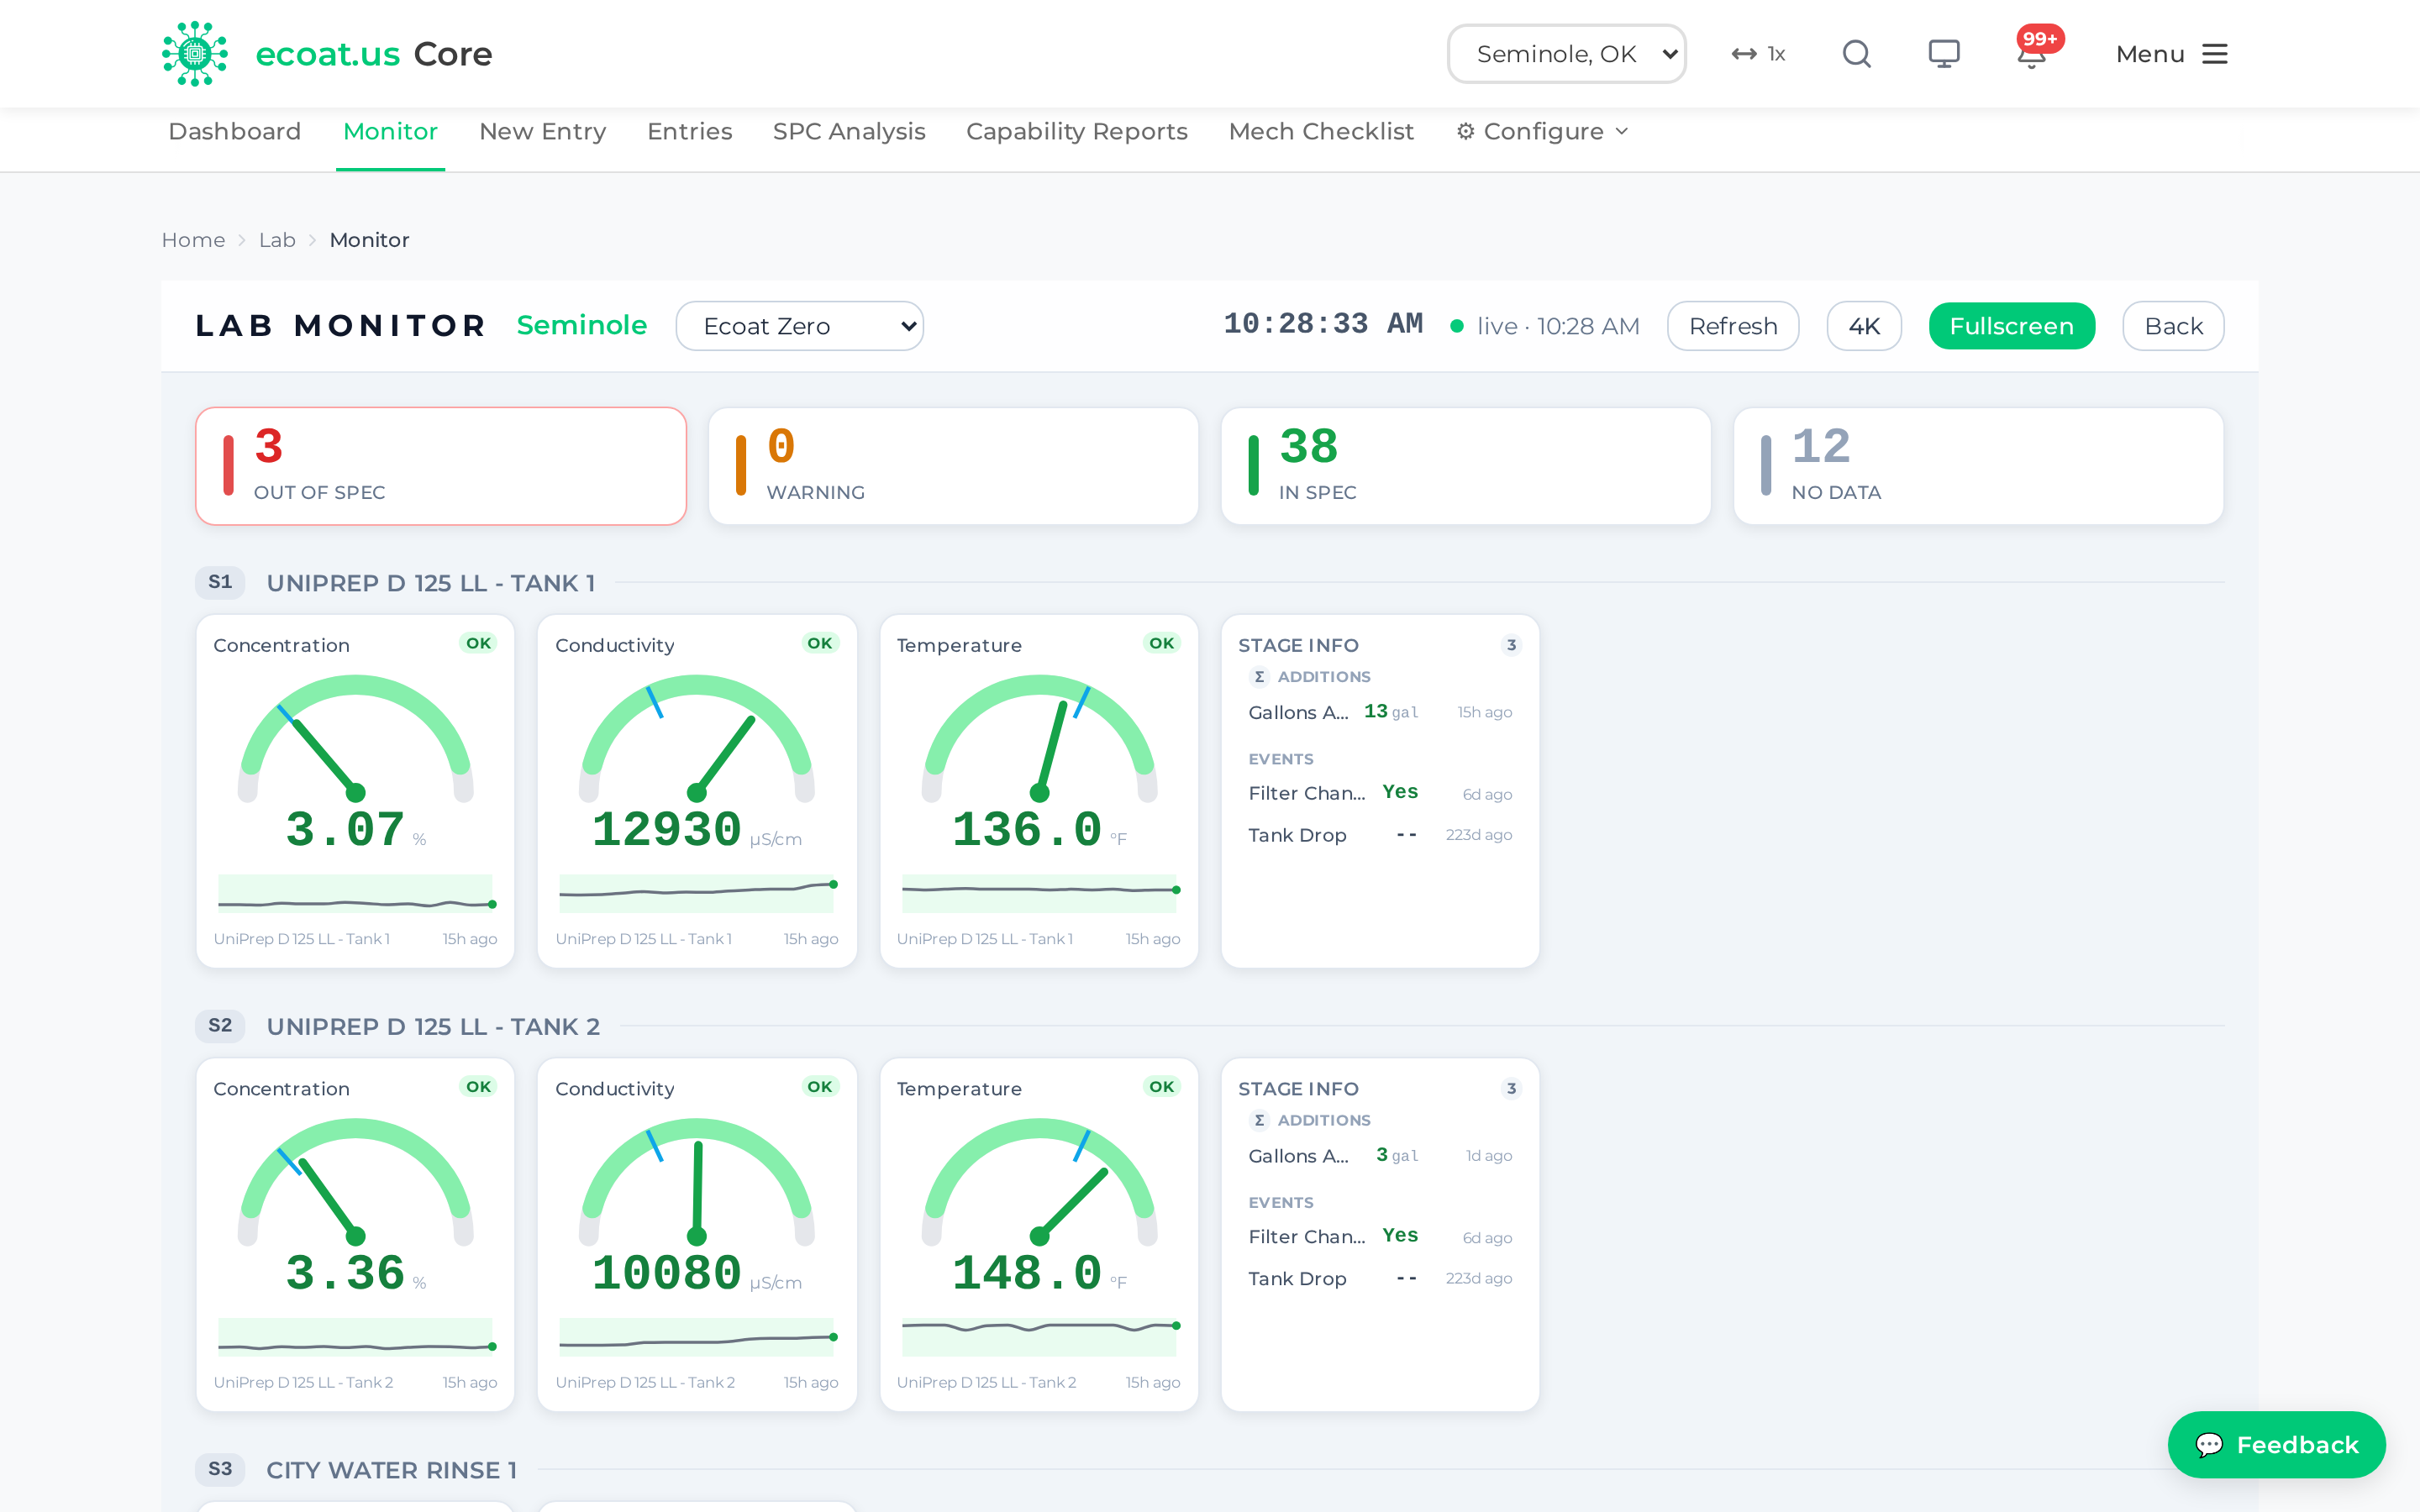
Each parameter shows as a gauge with its current value, min/max limits, target marker, and last-updated time. The color tells you the status instantly:
| Color | Status |
|---|---|
| Green | In spec |
| Yellow | Approaching a limit |
| Red | Out of spec |
| Gray | No recent reading |
Use the line selector at the top to switch processing lines, and the summary bar to see total OK / Warning / Out-of-Spec counts. Click any gauge to jump into its SPC chart.
Kiosk mode (for a wall display)
Monitor is designed to run unattended on a shop-floor screen:
- Click the Fullscreen (expand) button
- Data auto-refreshes every 60 seconds — the refresh toggle in the header turns this on or off
- Press Escape to leave fullscreen
Tip: Set the display to never sleep and leave auto-refresh on for a 24/7 board. You can also open a specific line directly, e.g. …/lab/monitor?line=Ecoat%20Zero.
The dedicated wall-display address
For a TV that nobody sits in front of, there is a second address built for the job: core.ecoat.us/lab/monitor-kiosk. It is the same gauge board, but with no app chrome (no sidebar, no tab bar) and the 4K layout forced on, so a small PC or stick behind the TV can be pointed at it and left alone.
Because there is no facility selector on screen, the kiosk address takes both settings from the URL:
core.ecoat.us/lab/monitor-kiosk?facility=Seminole&line=Ecoat%20Zero
There is no menu entry for it — type the address into the TV's browser.
Note: This address still requires a signed-in session on that machine. Log Core in once on the display PC and leave it logged in; if the session drops, the screen goes to the login page. Use the Fullscreen button on the normal Monitor page instead if you just want a big view at your own desk.
New Entry
The entry form is where technicians record readings for a shift. Open it from Lab → Entries ▾ → New Entry.
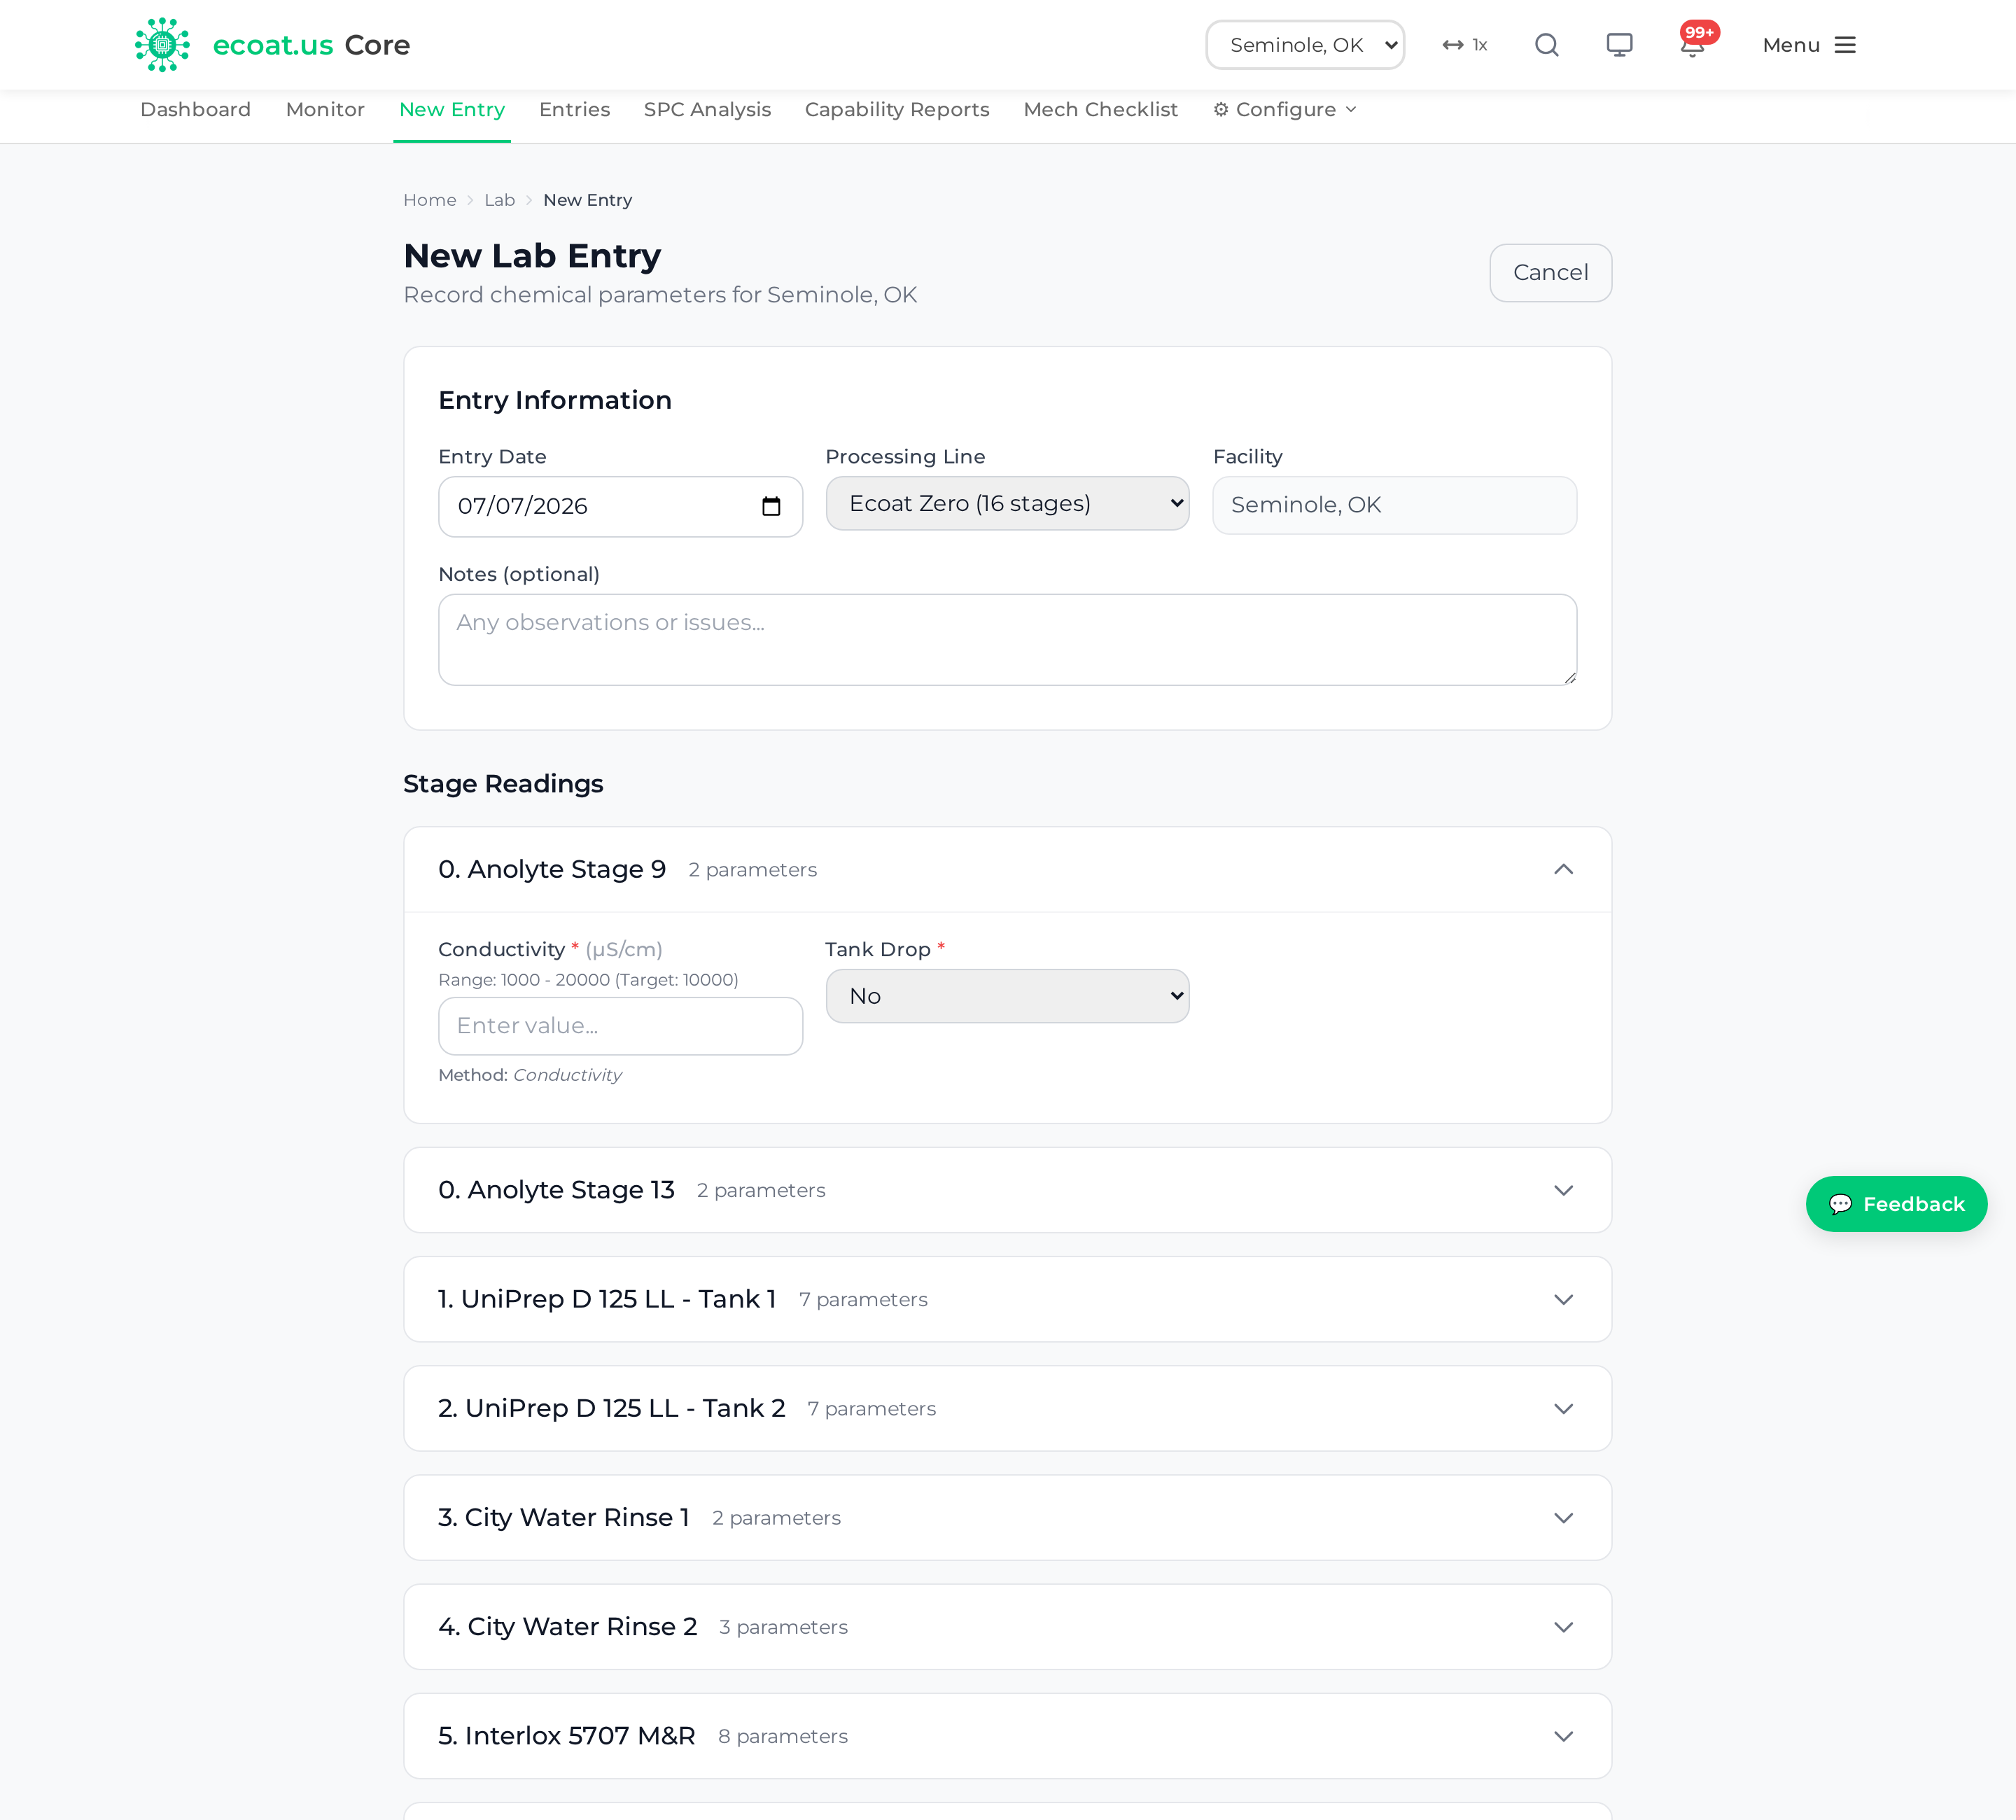
Start and fill an entry
- Go to Lab → Entries ▾ → New Entry
- Select the Line (e.g. "Ecoat Zero")
- Select the Shift (1st, 2nd, 3rd, or N/A)
- The date defaults to today — change it if you're back-entering
- The form loads organized by Stage (each chemical tank/process step is a collapsible section)
Expand a stage to see its parameters, then enter only the values you actually measured — sparse data is normal; a 10–15% fill rate per shift is typical.
- Numeric parameters: type the value. A green border means in spec; a red border means out of spec.
- Yes/No parameters (e.g. Tank Dumped, Filter Changed): tick the checkbox.
- Text parameters: free-form notes.
Some parameters show a Method note beneath the input describing how to run that titration — follow it exactly.
Out-of-spec detection
Core flags out-of-spec readings automatically: a red border on the input, an "X OOS" badge in the stage header, and an email alert to the lab team. Review any OOS reading before submitting to confirm it's real.
Save vs. Submit
- Save as Draft keeps your progress editable (status "Draft")
- Submit finalizes the entry (status "Submitted"), fires any OOS alerts, and locks it — after submission, contact IT for corrections
% Paint Solids calculator (Cleveland)
On stages set up for it (currently Cleveland Ecoat 5, Stage 11), the % Solids parameter appears as an interactive 3-tin calculator instead of a plain box:
- For each of 3 tins, enter three weights in grams — Baked (dried residue), Empty Tin, and Liquid (wet sample)
- Each row's % Solids computes live as
(Baked − Empty) ÷ Liquid × 100 - The bottom box shows the Average % Solids — this is the value saved
- A red border on the average means it's outside the 13–17% range
Click Enter manually to switch to a plain box (type the final % directly), or Use calculator to switch back. In calculator mode all 9 raw weights and the average are saved as readings; in manual mode only the final % is saved. Other facilities show a plain box unless an admin has seeded the tin-weight specs.
Entries
The Entries list shows every lab entry with its status. Open it from Lab → Entries ▾ → Entries.
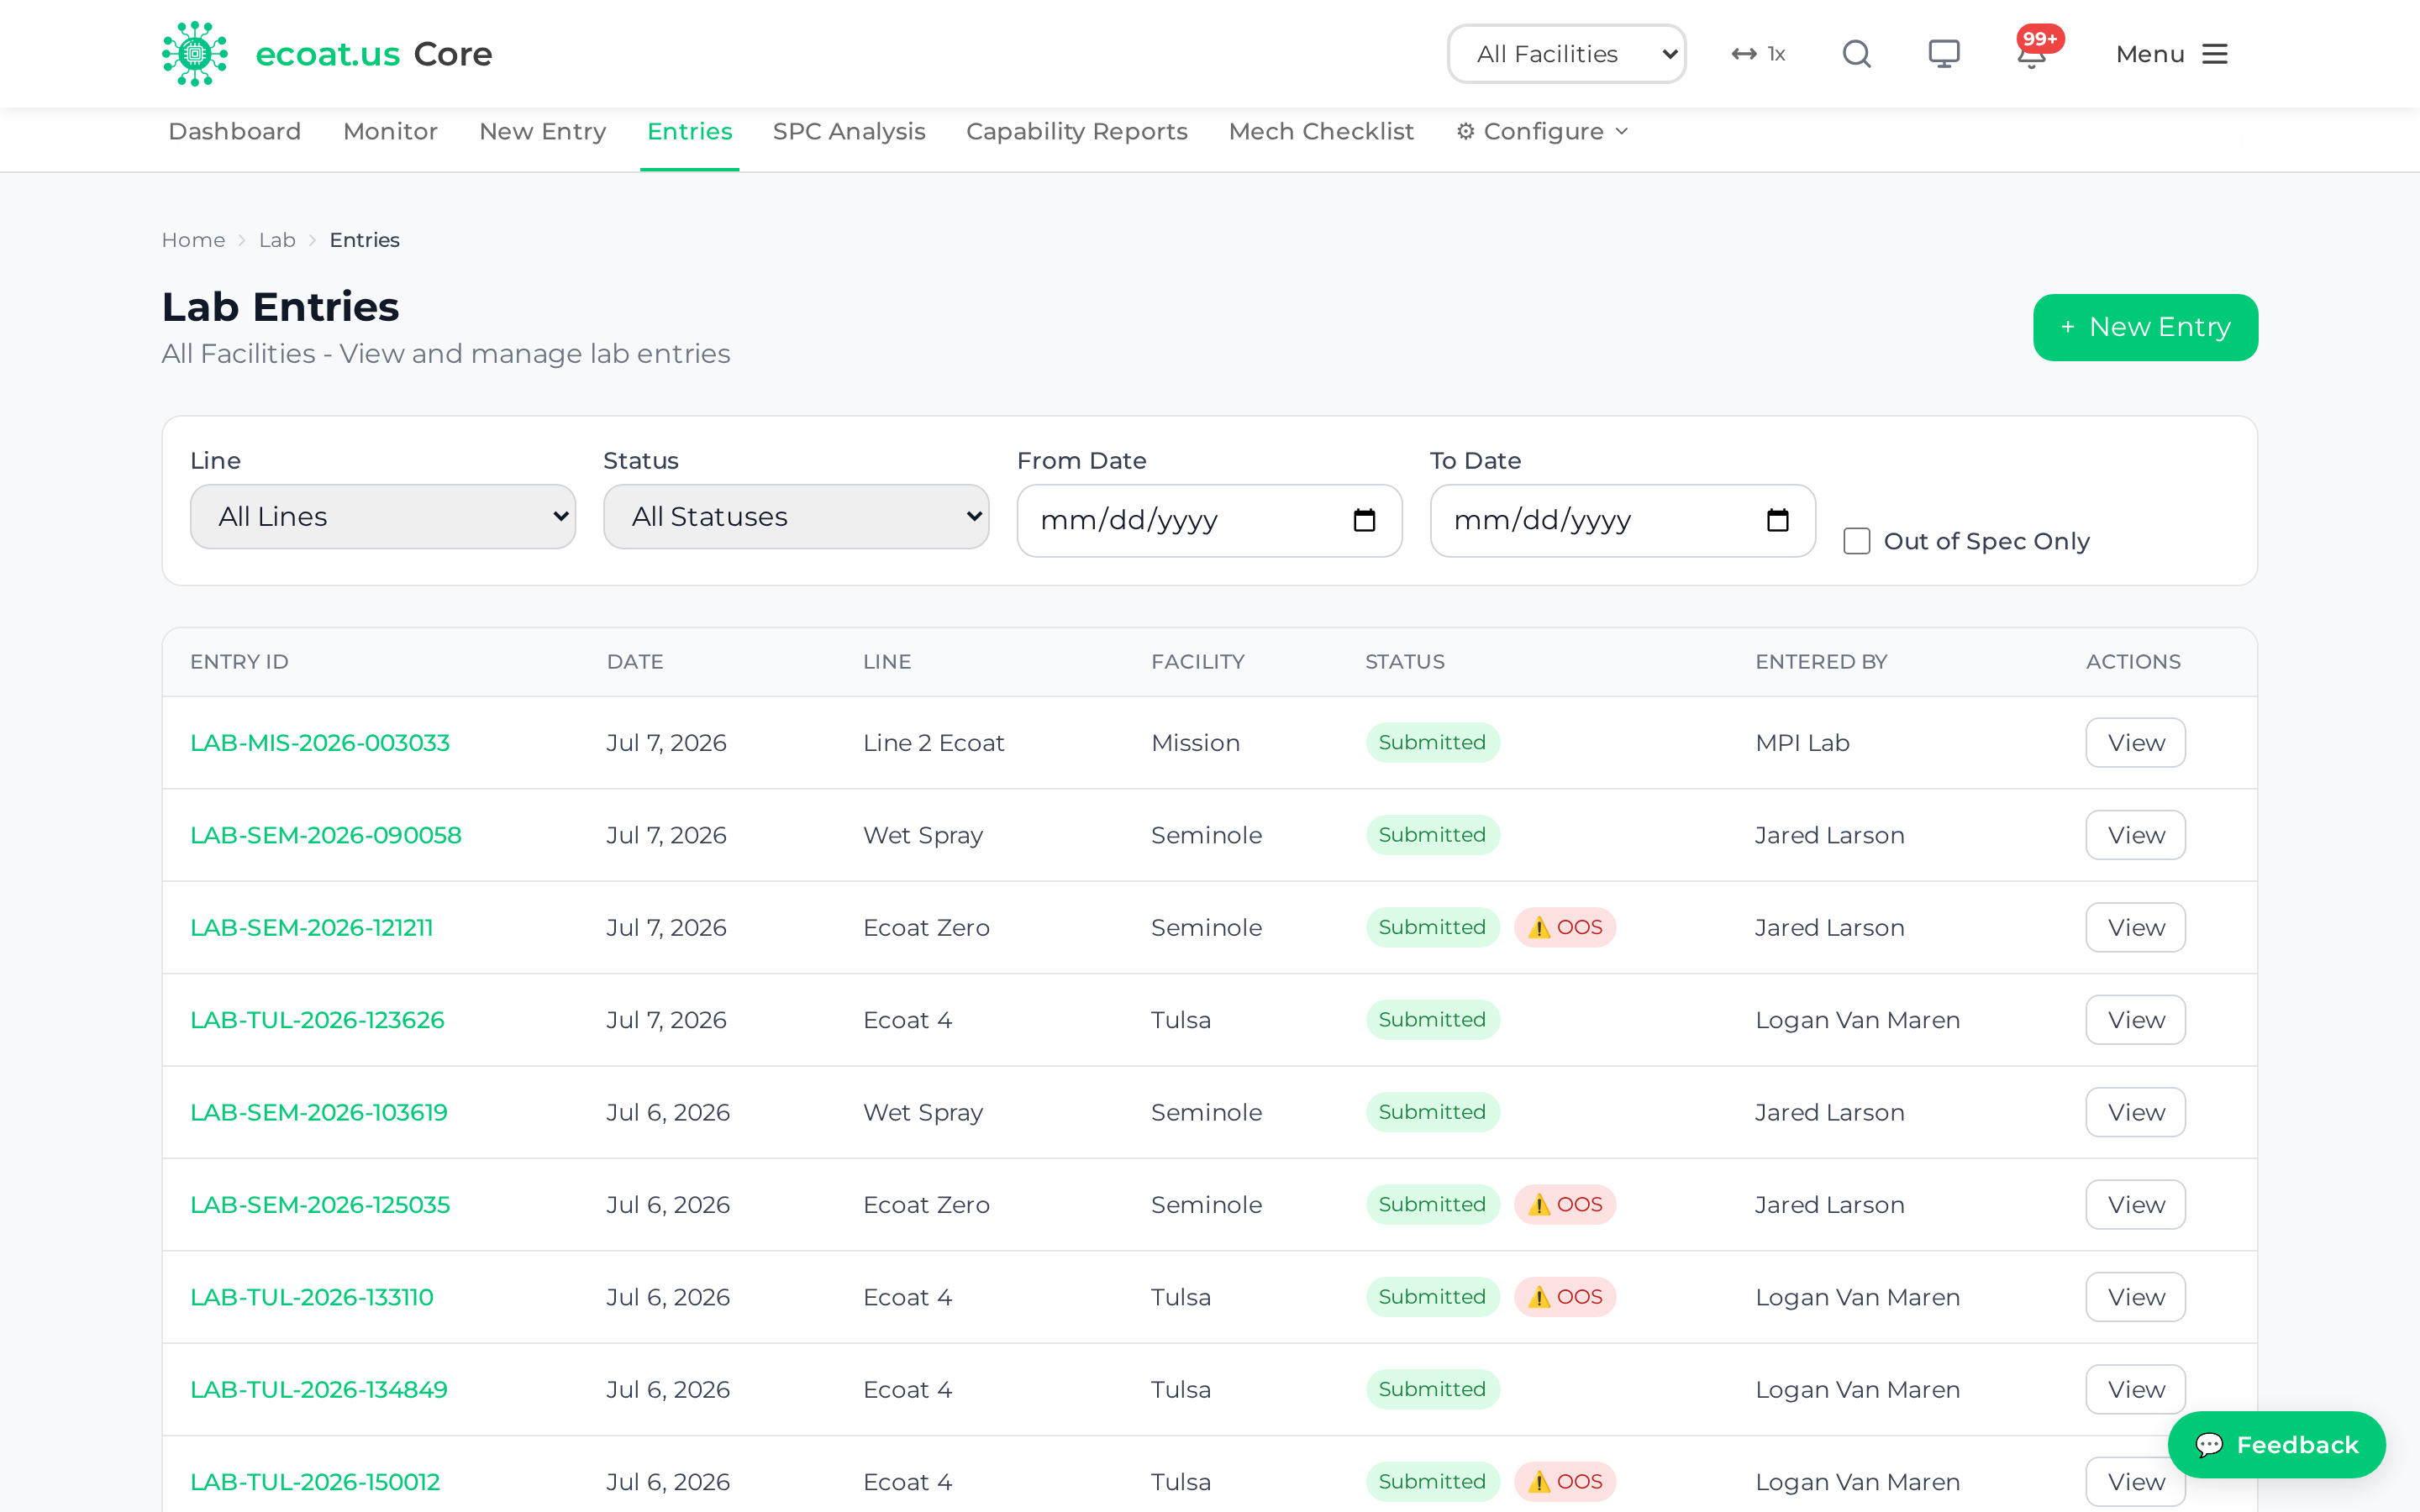
Each row shows the entry ID (LAB-NNNN), line, facility, technician, date, a status badge, and an OOS indicator. Filter by line, status, date range, or "out of spec only." Results are paginated (100 per page).
- Draft entries have an Edit button — continue and submit them
- Submitted entries open read-only via View
SPC Charts
SPC (Statistical Process Control) charts show whether a single parameter is stable over time, with control limits and capability indices. Open it from Lab → Analysis ▾ → SPC Analysis.
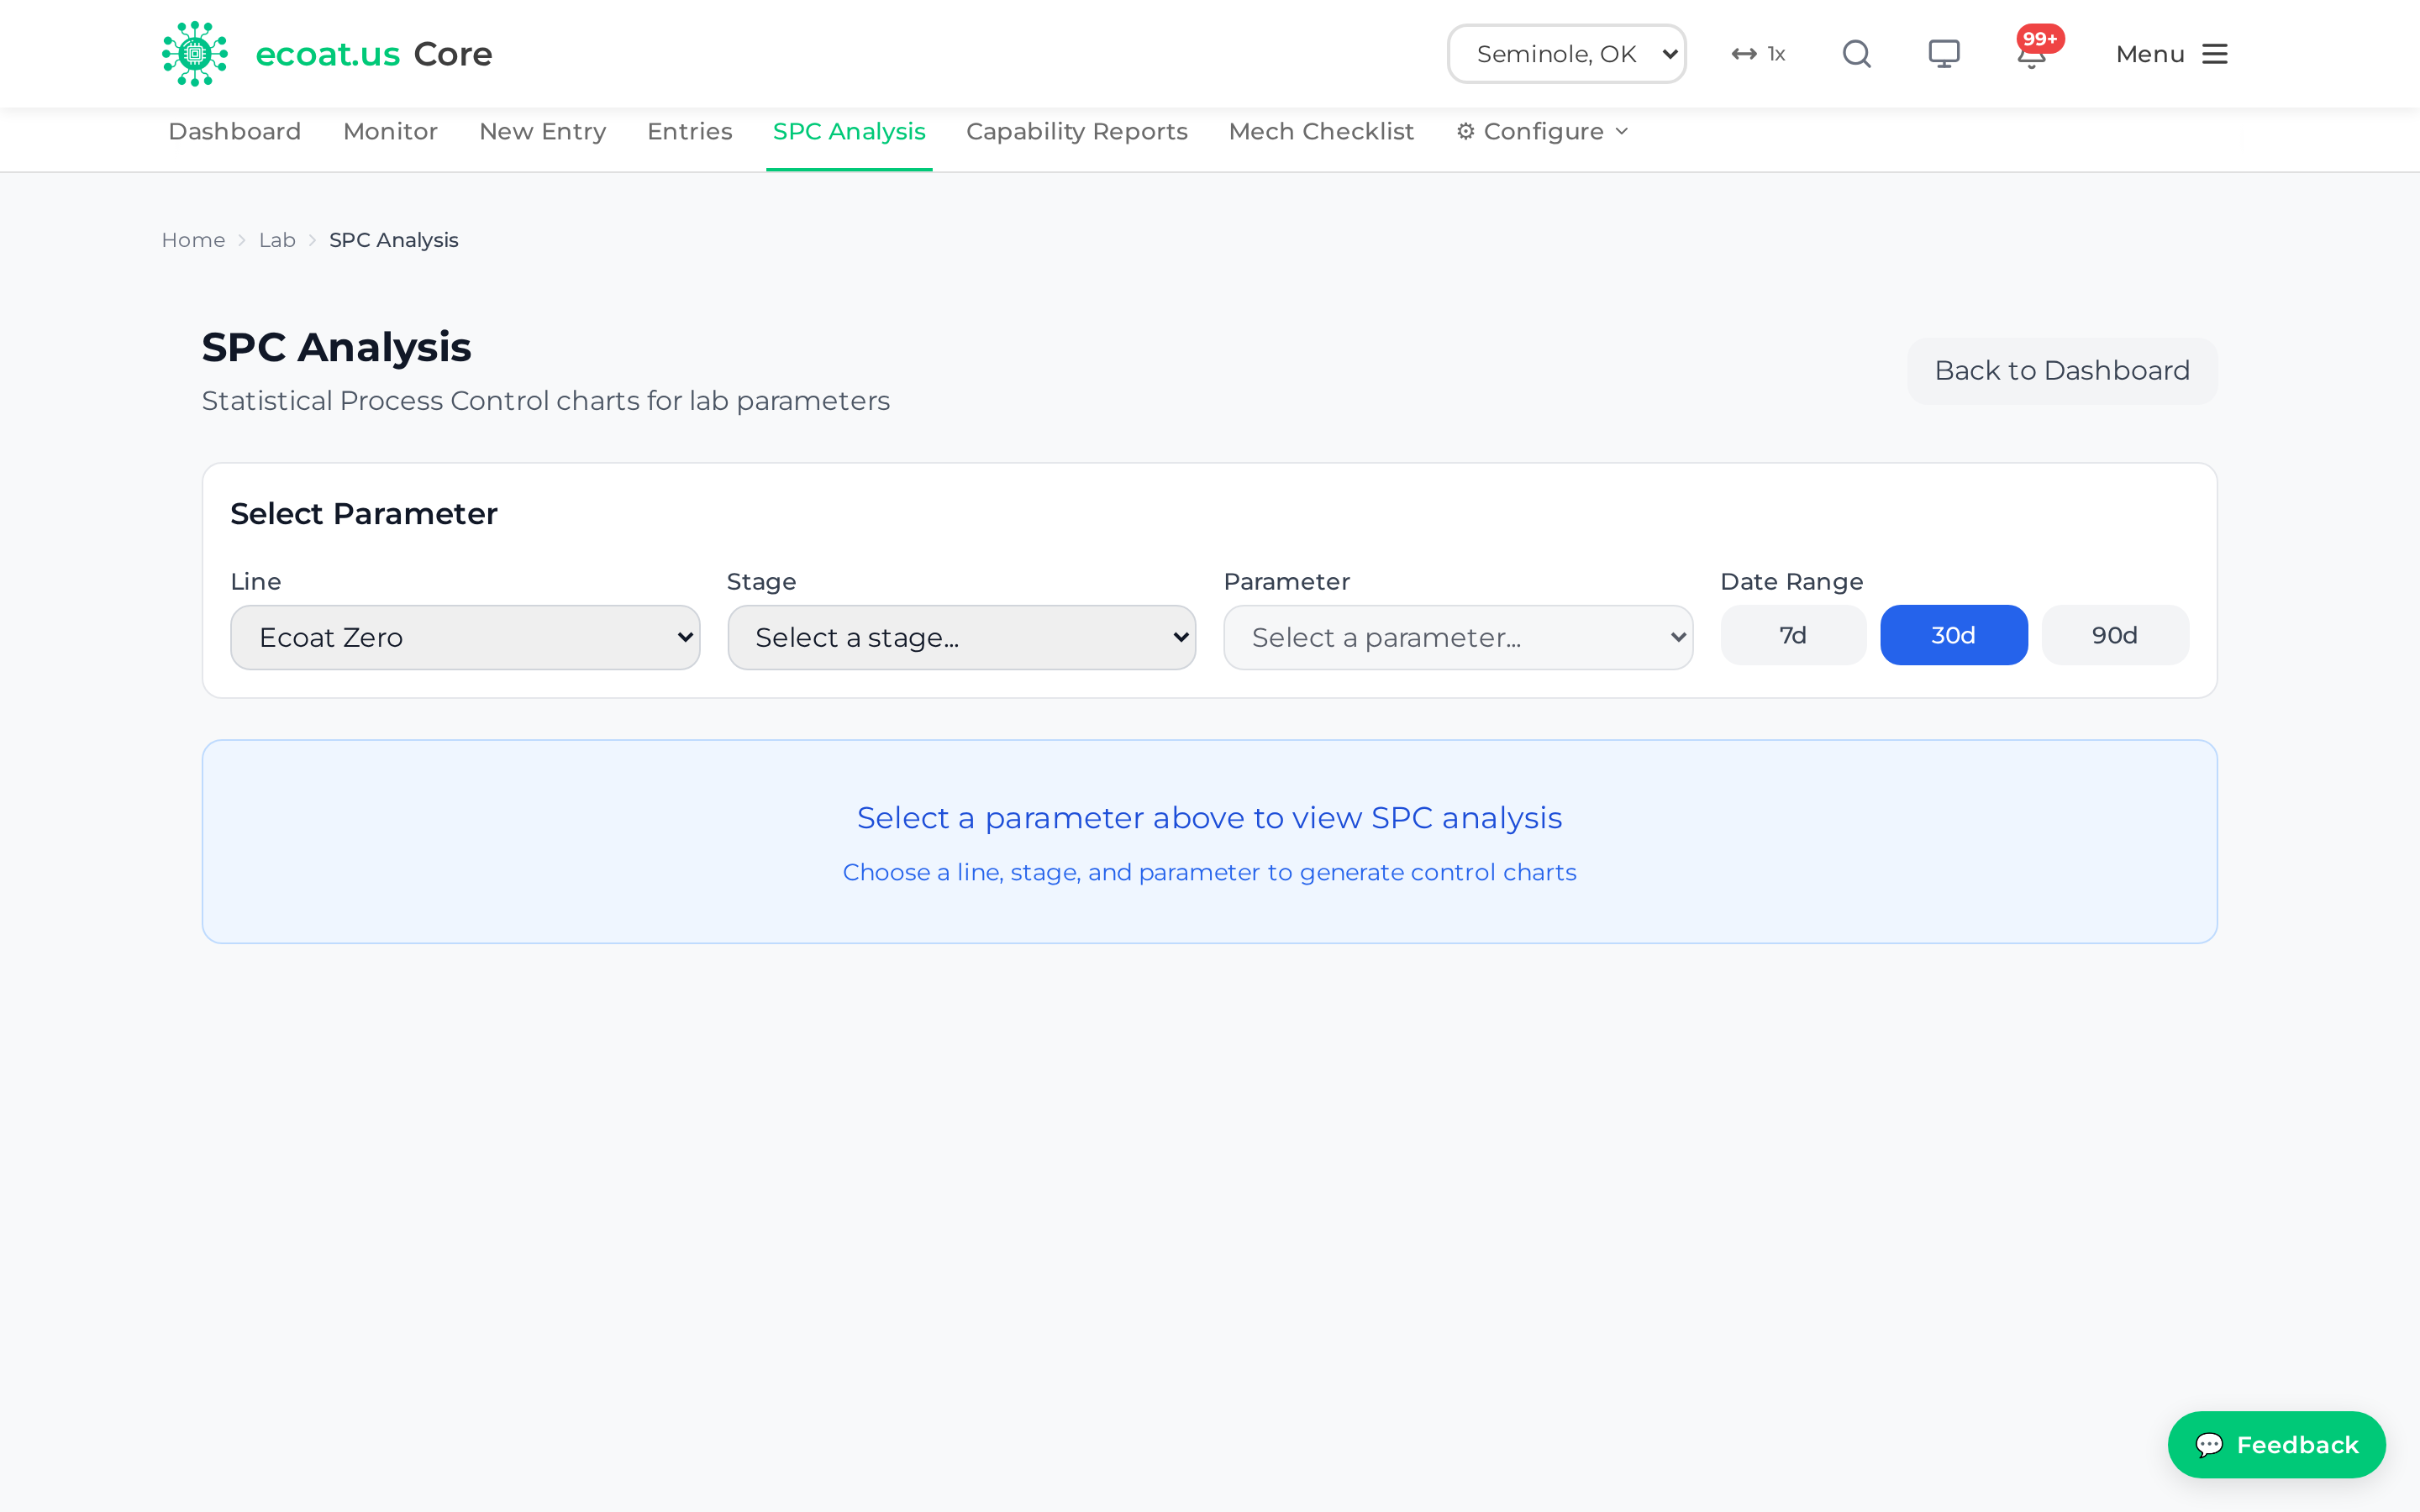
Read a control chart
- Choose Line, Stage, and Parameter
- Pick a date range (7, 30, 60, or 90 days)
The chart plots your readings against:
| Line | Meaning |
|---|---|
| UCL / LCL (red) | Upper / lower control limits (3σ) |
| Mean (green) | Average value |
| Target (blue dashed) | Specification target |
| Warning (orange dashed) | Warning limits (2σ) |
Red dots mark out-of-spec readings. A statistics panel shows Cp (potential capability) and Cpk (actual, centered capability) — 1.33 or higher is capable; below 1.0 is not. Parameters without defined limits may show "N/A."
Control limits are usually calculated from your data (dashed lines) but a lab admin can set fixed limits for parameters with known process bounds (solid lines, labeled "Fixed").
Capability Reports
Capability Reports are the formal, printable, branded PDF for a whole processing line — the version you hand to management, customers, or an ISO auditor. Open it from Lab → Analysis ▾ → Capability Reports. For live monitoring use Monitor or SPC instead; this is the signed-record view.
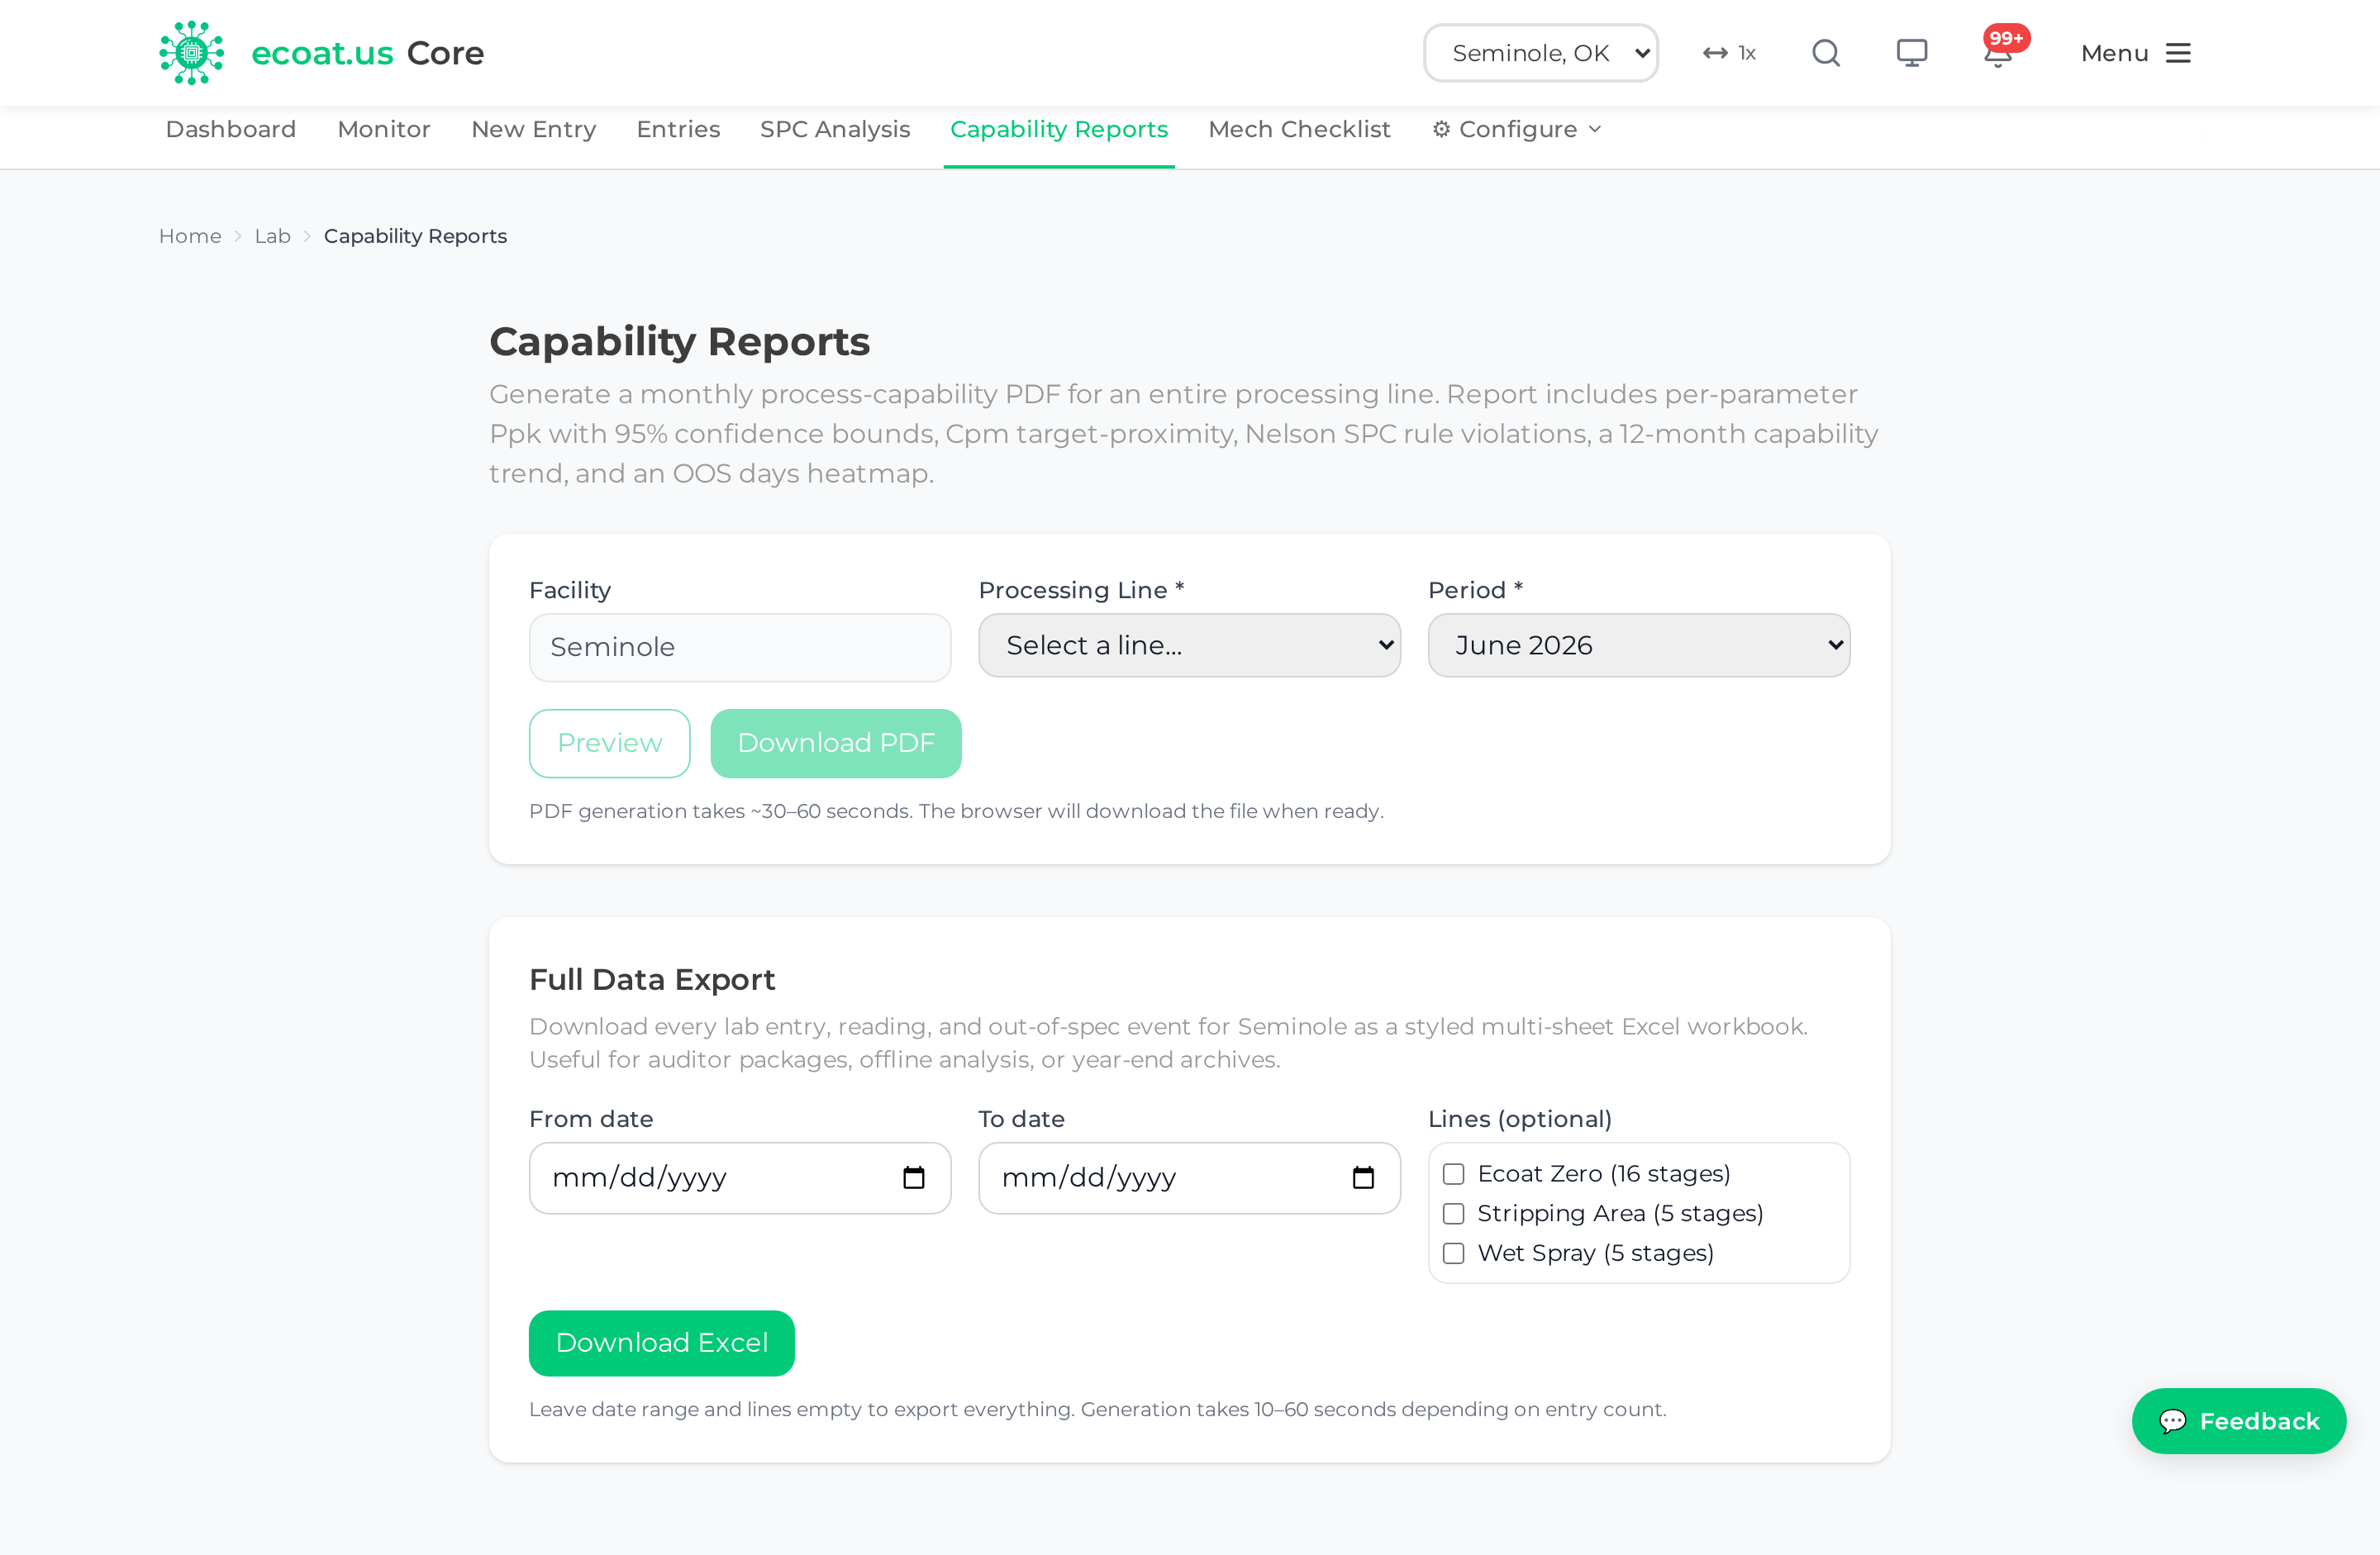
Generate a report on demand
- Go to Lab → Analysis ▾ → Capability Reports (facility is locked to your current facility selector)
- Pick a Processing Line (e.g. "Ecoat 5")
- Pick a Period (the most recent 12 months are listed)
- Click Preview to see cover-page metrics quickly (~1 second)
- Click Download PDF to generate the full report (~30–60 seconds)
The PDF is built from current submitted readings; drafts are excluded. It includes a cover page with the capability headline and sign-off block, a line-level summary table, per-parameter detail pages (control chart, histogram, trend), and methodology and stats appendices.
Tip: The report leads with Ppk 95% LCL (the lower confidence bound), not the point estimate. With small monthly samples the point estimate can look better than the process really is, so the lower bound drives every tier color — a more honest read than a raw Ppk number.
Permissions: Report generation is gated to lab-admin, lab-manager, plant-manager, quality-manager, and IT/admin groups. If you don't see the menu entry, ask IT to add you.
Scheduled monthly delivery
If your email is in the Report Subscriptions table, the previous month's report is generated and emailed to you automatically at 07:00 UTC on the 1st of each month. Use the on-demand download for anything between scheduled runs.
Mechanical Checklist
The Mechanical Checklist is the daily visual/mechanical equipment inspection. It is listed in the menu as Mech Checklist — open it from Lab → Analysis ▾ → Mech Checklist.
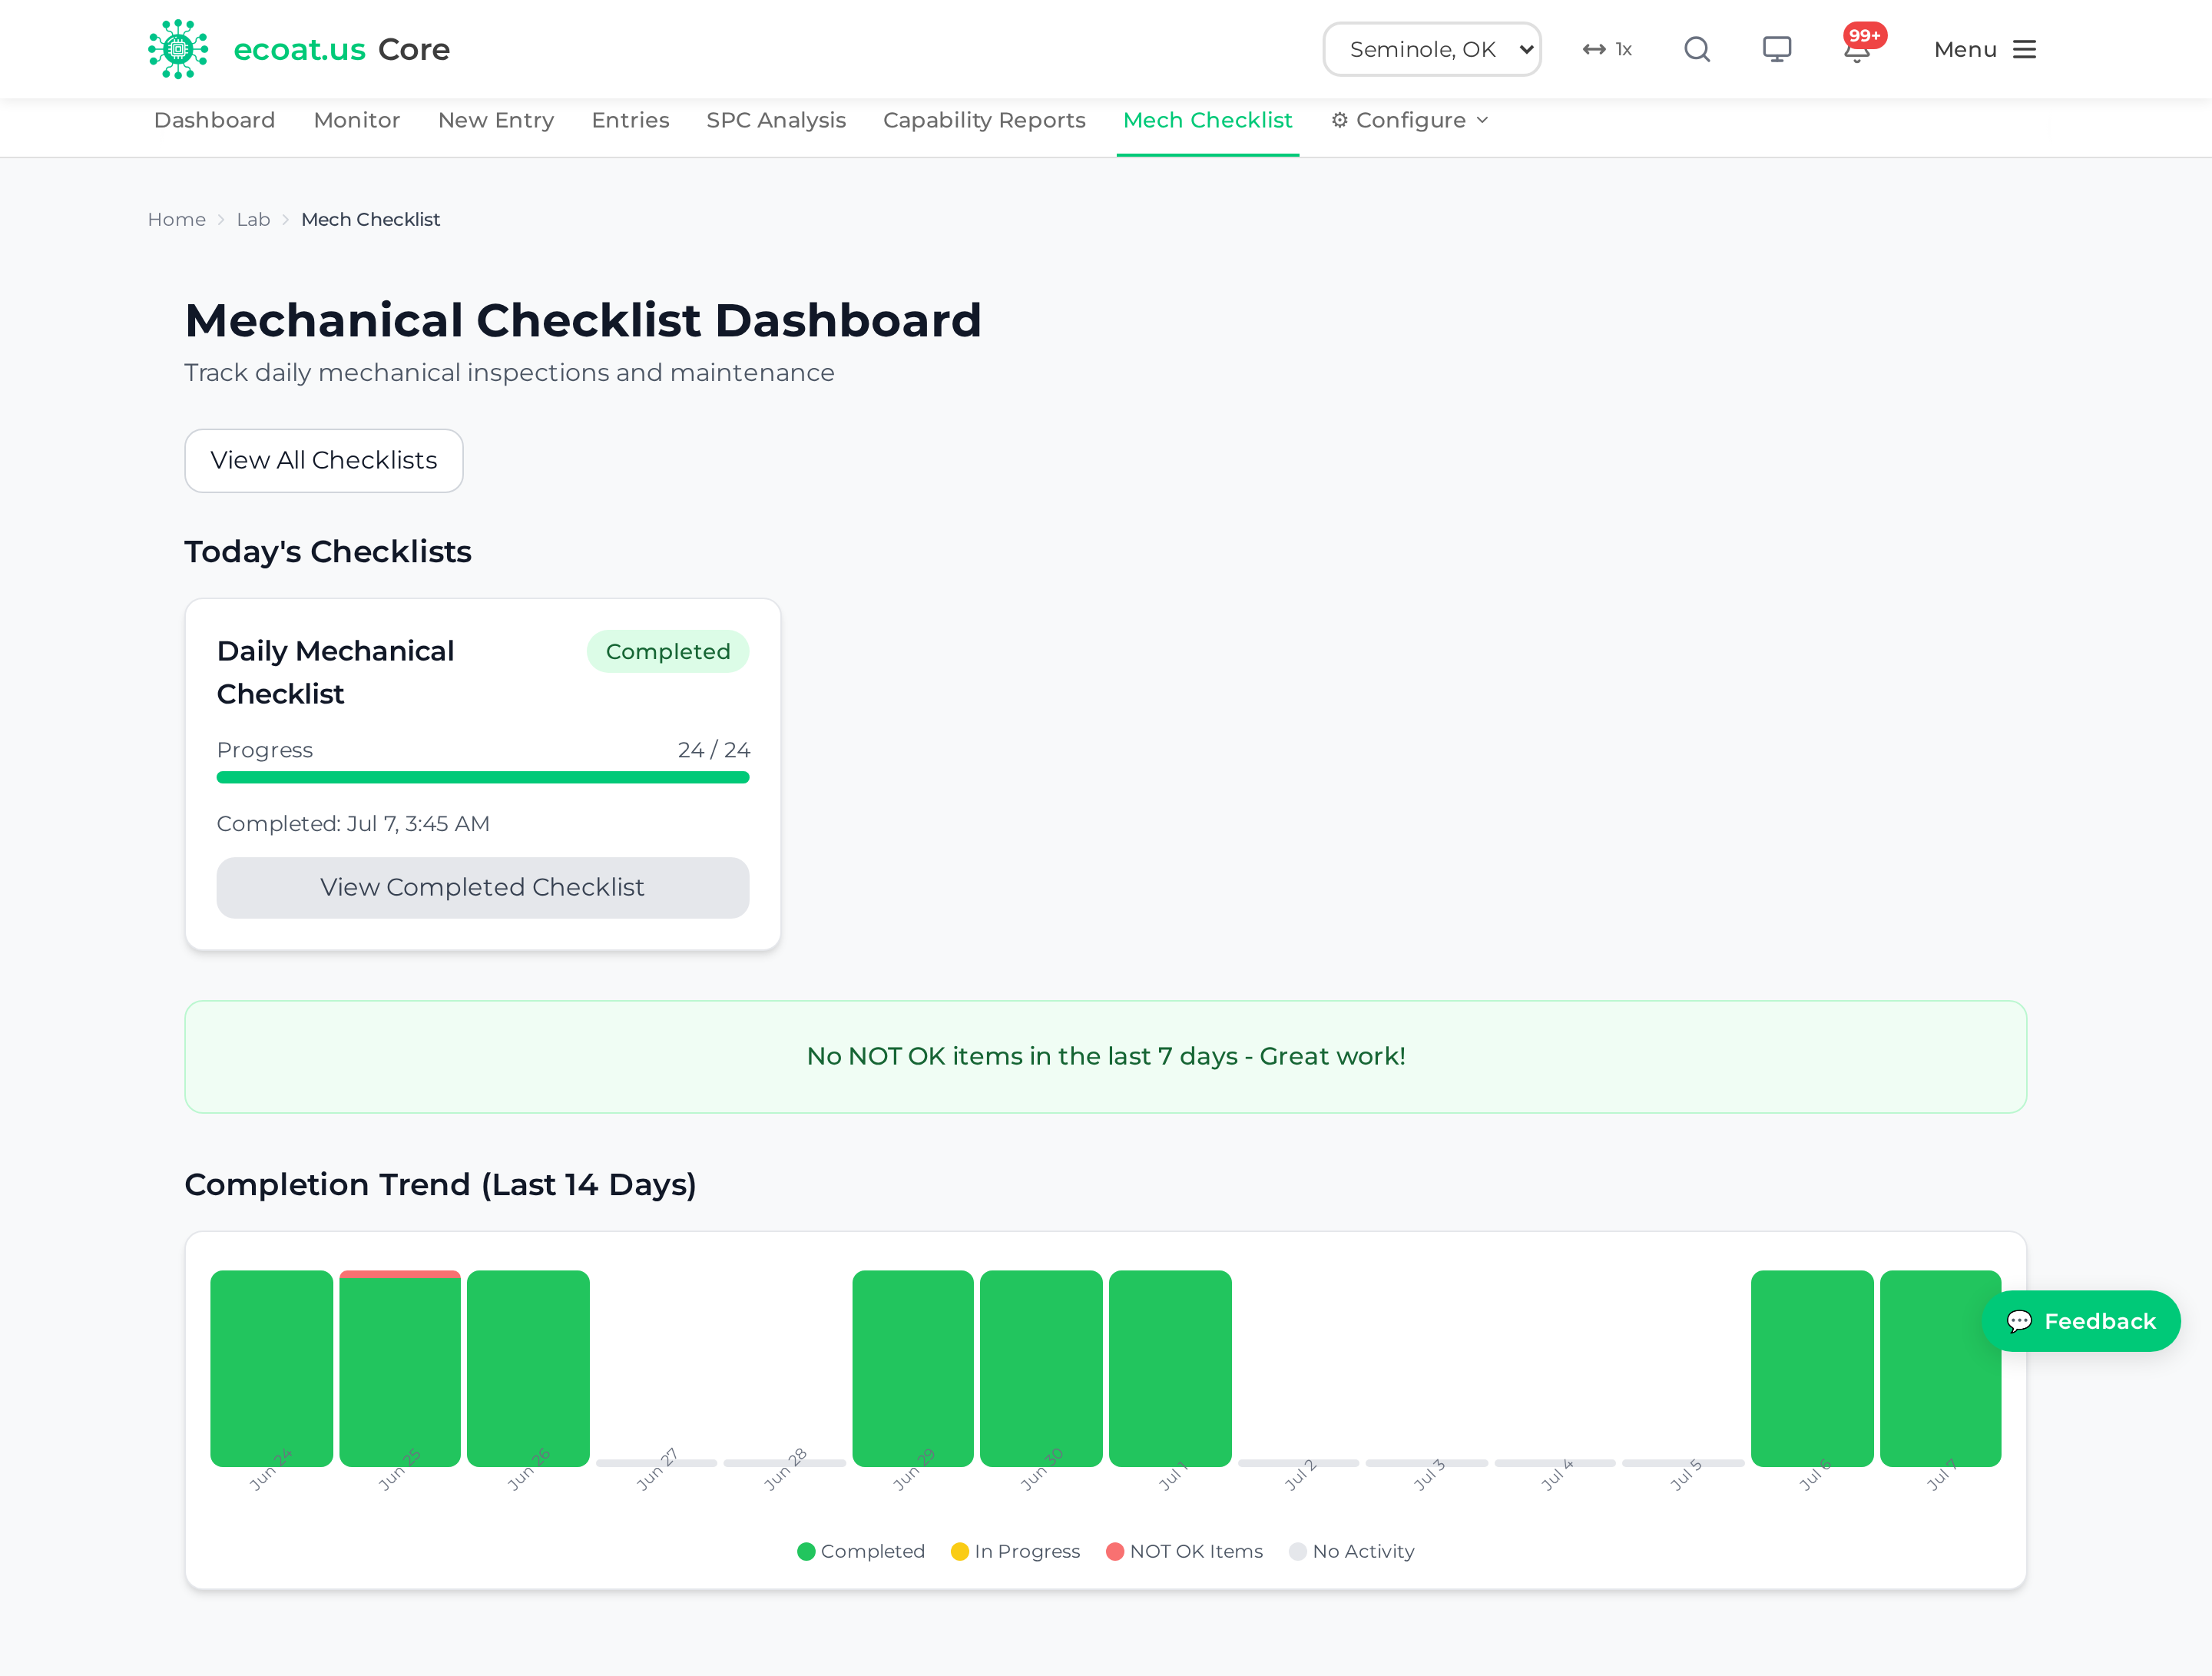
Complete a checklist
- Go to Lab → Analysis ▾ → Mech Checklist
- Click Start Checklist (or continue today's)
- For each check point, set OK, NOT OK, or N/A - If NOT OK, add notes explaining the issue - If the check point takes a reading, enter the numeric value
- Click Complete when every item is reviewed
Check points are grouped into sections (Pumps, Filters, Mixers, Tanks, Heaters). Any NOT OK item automatically alerts maintenance.
Permissions: Everyone can complete checklists. Building and editing the checklist templates is admin territory (see Configuration below).
Configuration (Supervisor / Admin)
The pages in this section define how the Lab module behaves — the stages, the specifications, how tank additions draw down inventory, who gets scheduled reports, and the mechanical checklist templates. They are supervisor and lab-admin territory; most technicians never need to open them. Changes here affect everyone at the facility, so make them deliberately.
Permissions: All Configuration pages require lab-admin or IT-admin access.
Stages
Configure the processing stages (chemical tanks/steps) for each line. Open it from Lab → ⚙ Configure ▾ → Stages.
Create a stage with a stage number, name, facility, and line. Optionally enter tank dimensions so Core can calculate tank volume, and define a chemical bath mix (each chemical with a ratio and unit) so the bath-mix calculator can work out required quantities for a target volume.
Specs
Configure the test parameters and their limits. Open it from Lab → ⚙ Configure ▾ → Specs.
For each specification set the parameter name, type (numeric, boolean, or text), and the stage it belongs to, plus Min / Max / Target limits. You can also add a Method (titration instructions shown to technicians during entry), UCL/LCL overrides (fixed SPC limits for parameters with known bounds), a test frequency (informational), and — for derived values — a Calculator such as the % Solids 3-tin average (which needs 9 named child specs on the same stage).
Additions → Inventory link
This page maps a lab "tank-add" parameter to the inventory item it consumes, so recording an addition automatically draws that material down from stock. In the menu it is called Add → Inventory — open it from Lab → ⚙ Configure ▾ → "Add → Inventory". The page header reads Tank-Add → Inventory Mapping.
Each row pairs an Add parameter on a stage with the inventory item it deducts and a conversion factor (lab unit → inventory unit). When a lab entry is submitted, each Confirmed add deducts its mapped item (quantity × factor) from inventory. To set one up, click Edit on a row, search inventory by name or MFG part number, set the factor, and tick Confirmed so it deducts on submit. Rows can be marked Active/Inactive, and unmapped rows are flagged "— not mapped —."
Tip: Leave a mapping Unconfirmed until you've verified the item and factor. Only confirmed mappings actually move inventory. "Additions Made" totals are intentionally excluded from deductions.
Report Subscriptions
Manage who receives the scheduled monthly Capability Reports by email. Open it from Lab → ⚙ Configure ▾ → Report Subscriptions.
Click + Add Subscription, then enter the recipient's email, facility, and the Line name exactly as it appears in Lab (e.g. Ecoat 5), and a report type (monthly is the only one currently wired). If several people subscribe to the same facility + line, Core generates one PDF and emails it to all of them. Prefer toggling a subscription inactive over deleting it when someone steps away temporarily — the row stays as an audit trail.
Mechanical Templates
Build and maintain the mechanical checklist templates. In the menu it is called Mech Templates — open it from Lab → ⚙ Configure ▾ → Mech Templates.
Admins create a template per facility, add and edit check points grouped by section, set numeric reading limits (min/max/unit) per point, clone a template to another facility, and deactivate check points no longer needed.
Production
Production
The Production module follows a job from the moment it lands on the floor to the moment it leaves on a truck. You create a lot, route it through your shop's process stages, clear the quality gates, print the paperwork that travels with it, and ship it on a Bill of Lading. Along the way the module keeps score — on-time delivery, bottlenecks, paint usage — so supervisors can see where work is piling up.
Everything lives under the Production tab in the top navigation. This chapter walks through each part roughly in the order a lot moves through it.
How the Production menu is laid out
Open Menu → Production and the sub-nav bar under the header shows three plain tabs followed by four dropdowns:
| Sub-nav item | What's inside |
|---|---|
| Dashboard | the live floor view |
| Lots | the full lot list |
| Invoicing | the accounting desk — only appears with invoicing access |
| Production ▾ | Parts · New Lot · Batching · Master Label · Shipping |
| Paint ▾ | Paint Log · Paint Dashboard |
| Reports ▾ | OTD · Labor · Reports · Report Builder |
| Admin ▾ | Admin · Kanban Kiosks |
Shipping also has its own top-level item in the main Menu, next to Production — a shortcut for the shipping desk so the dock isn't three clicks deep. Both routes open exactly the same page.
Throughout this chapter, a path like Production → Production ▾ → Batching means "open Production, then the Production dropdown in the sub-nav, then Batching."
Permissions: Everyone with Production access can view lots, dashboards, BOLs, and reports. A few entry points are gated by tier: New Lot and Master Label need supervisor, and Admin (process and master-data setup) and Kanban Kiosks need admin. Those items simply won't appear in your menu if you don't have the tier.
Note: FAI (First Article Inspection) appears under both Production and Quality (QMS). It's the same tool in both places — it was moved to Quality but kept on the Production menu so older links and notifications still work. FAI is covered in the Quality chapter.
Production Dashboard
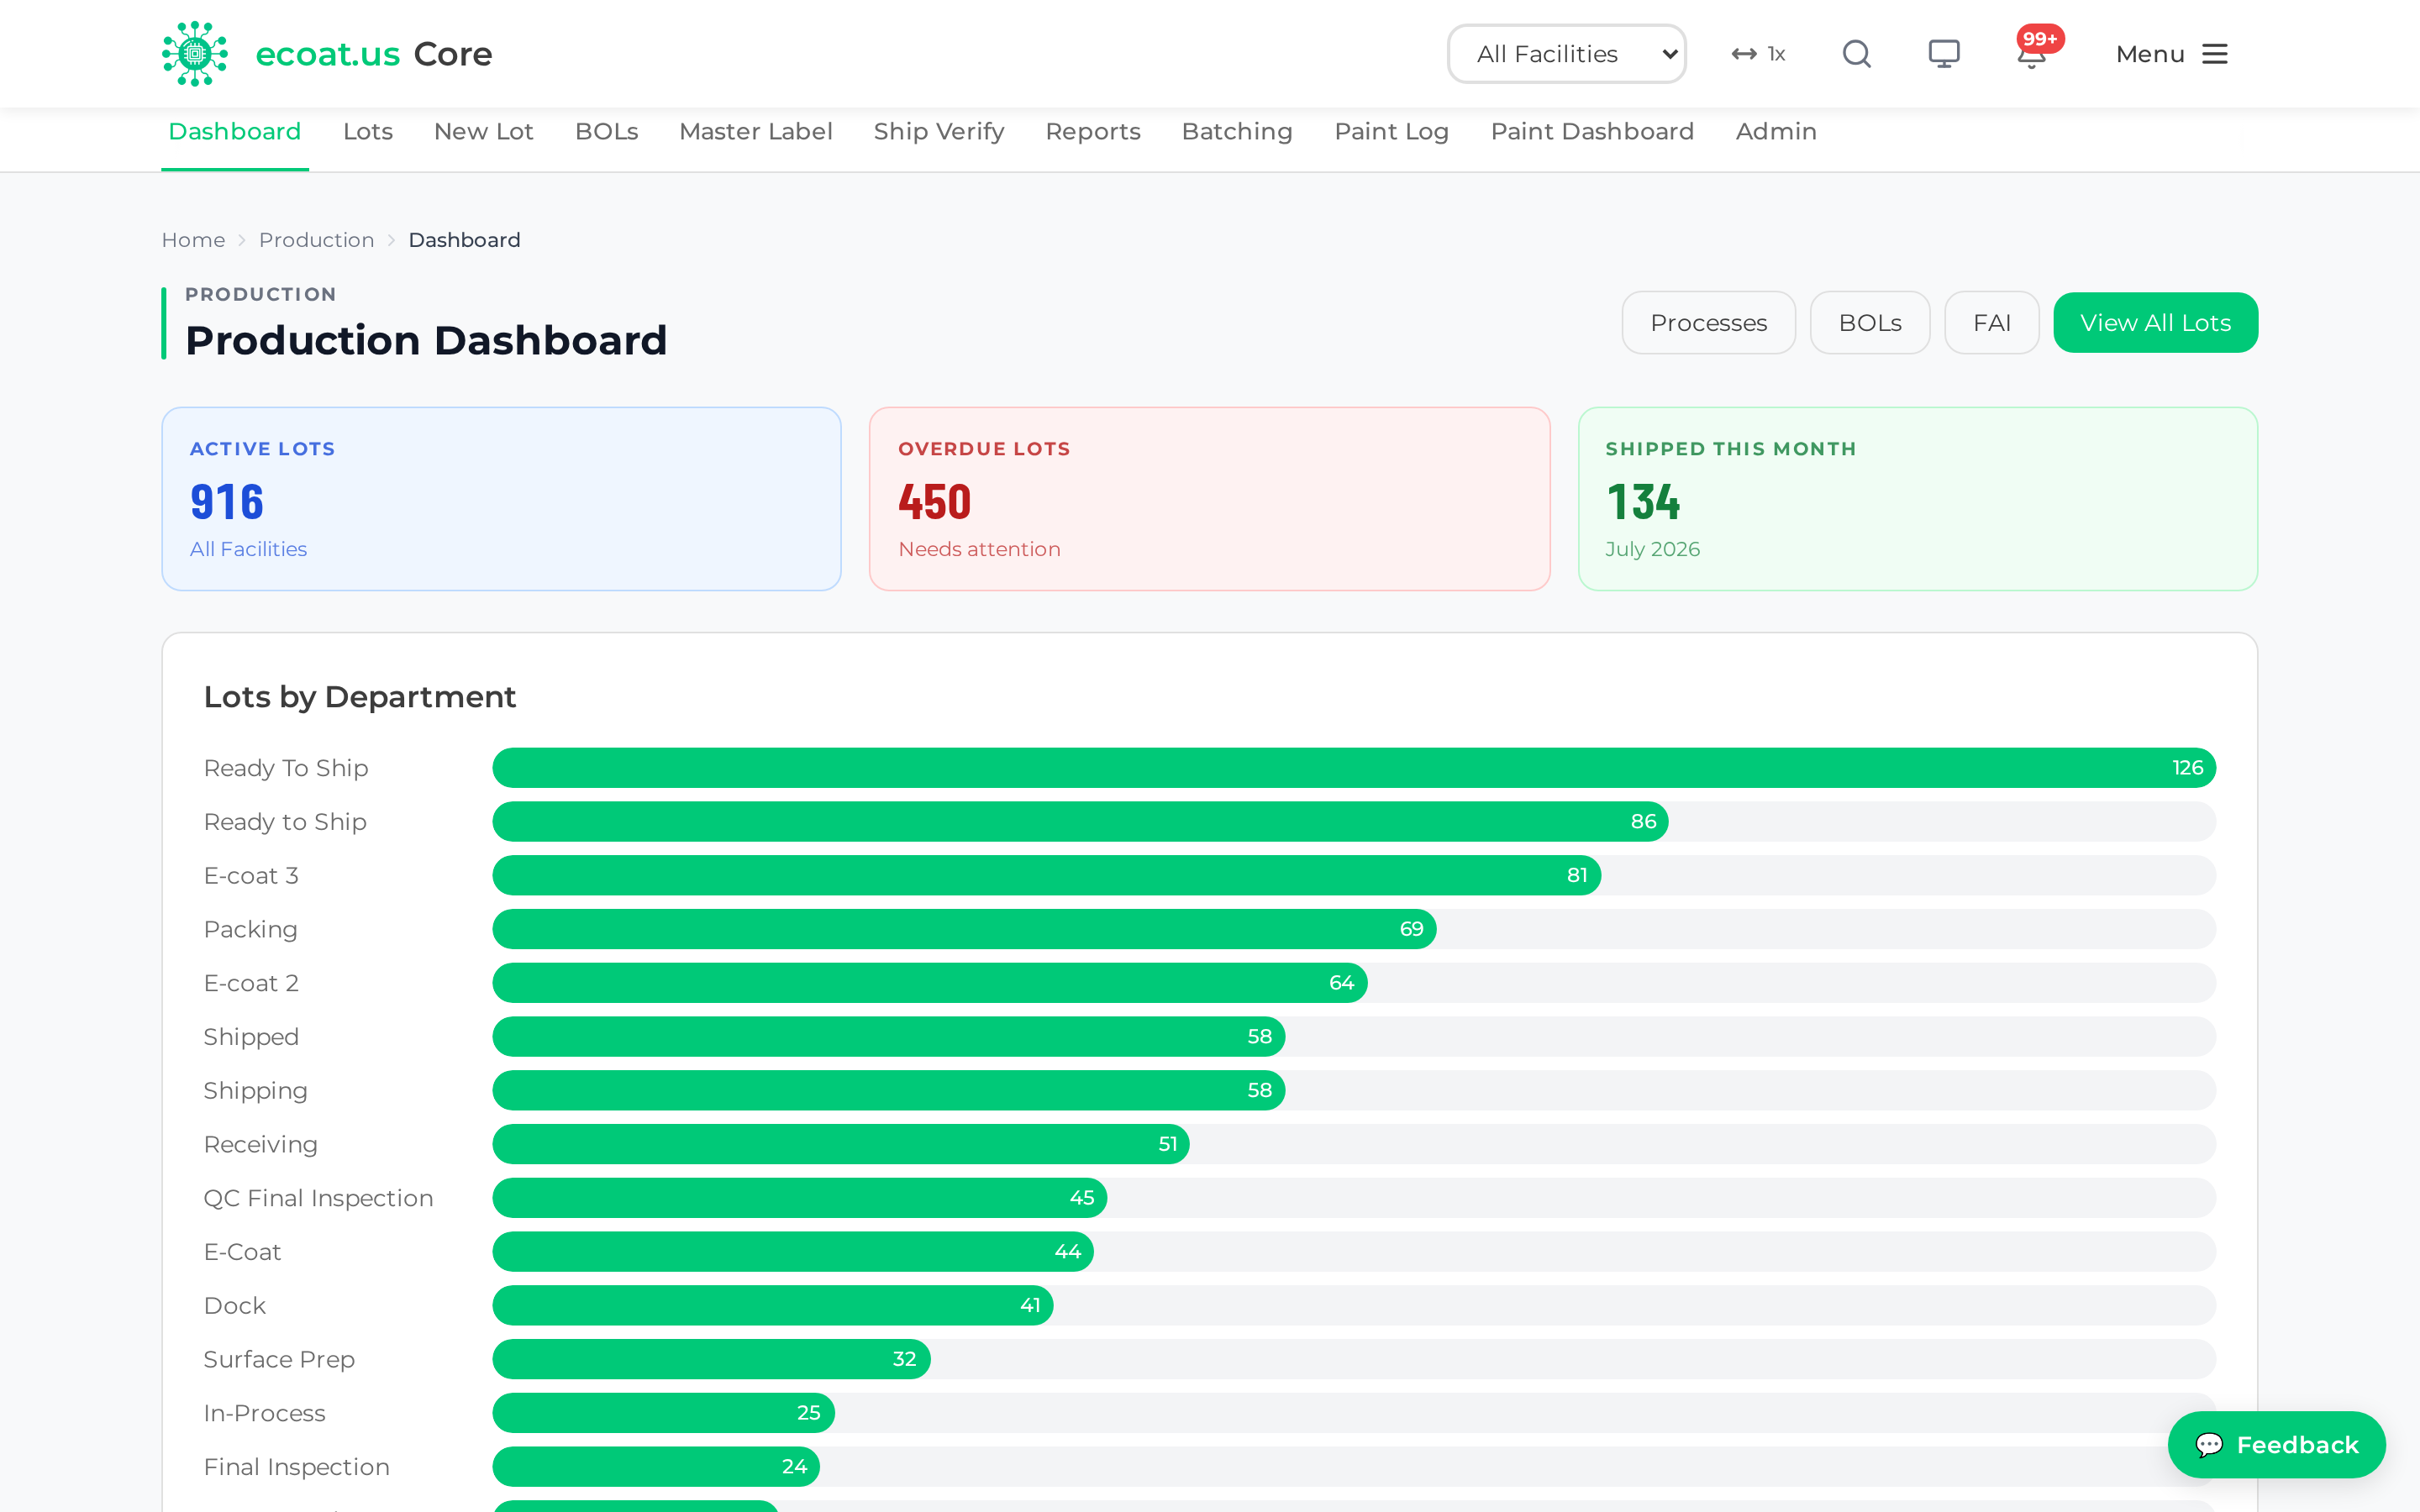
The dashboard is your live view of everything on the floor. It's the first thing you see when you open the Production tab.
What you'll see
- Active lots — everything currently in production at this facility
- Overdue lots — anything past its due date
- Shipped this month — a running count of completed work
- A Kanban board that lays out lots as cards grouped by their department stage
Find a lot
- Use the search box to look up a lot by lot number, customer, PO, or part number.
- Filter by status to narrow the board down.
- Click any card to open the lot's detail page.
Tip: The facility selector in the top bar scopes the whole module. If a lot you expect is missing, check you're on the right facility (Seminole, Tulsa, Cleveland, or Mission).
Lots
A lot is one production job — a quantity of one part, for one customer, against one PO. The Lots page is the full searchable list behind the dashboard's board.
Take the list off the screen: Export and Run List
Three buttons sit above the lot list. All of them respect the filters you've set, so filter first, then export — it's faster and the file is easier to read.
- Export Excel — downloads a real Excel workbook (
.xlsx) of the lots currently listed. Use this when the file is going to someone who will sort, filter, or pivot it. - Export CSV — the same rows and columns as plain text, for importing into another system.
- Run List — opens the printable floor sheet described below.
Be patient with a wide export. Core reads every lot row for the facility before it can build the file — roughly 20,000 rows — so an unfiltered export takes about two minutes. The button reads Exporting… while it works; don't click it again. Narrowing to one department first cuts the wait dramatically.
The Run List (printable floor sheet)
The Run List is the "what runs next" sheet for the floor — the soonest-due lots, sorted by due date, on one printable page.
- On the Lots page, click Run List. (It has no menu entry of its own and won't turn up in Ctrl+K — the button on Lots is how you get there. The address is
/production/run-list.) - The page lists up to the 100 soonest-due lots for the selected facility, overdue first, each with its customer, part number, quantity, remaining, department, due date, days late or left, and an on-time chip.
- Click 🖨 Print. The page is print-first — the navigation, sub-nav, and the Print button itself drop away, leaving a clean sheet with the time it was printed in the header.
Tip: This is a snapshot, not a live board — the printed time in the header is there so a stale copy on the wall is obvious. Reprint it each morning.
Create a new lot
- Click New Lot.
- Search for a product by part number or description and select it.
- Fill in the job details: - Customer, PO #, Quantity, Due Date - Optional: Skids, Expedite level
- For coil products, the # of Clamps field appears and is calculated for you from the product's coil dimensions. It applies to coils only — you won't see it on other parts.
- Click Create.
The lot gets a unique lot number and starts in the first department stage.
Permissions: Creating a lot requires the supervisor tier.
Tip: Coil lots that need serial tags should be created through the coil-specific receiving flow, not the generic New Lot form — the generic form has no serial-tag step and would skip it silently.
Receiving a lot at the dock
Tulsa, Cleveland, and Mission don't use the New Lot form at all — they create lots by receiving them. At those plants the Lots page carries a Receive Lot button, and choosing New Lot from the menu simply redirects you there, because the receive flow has the serial-tag and photo steps the generic form lacks. (Testopia, the demo facility, behaves the same way. Seminole uses the New Lot form above.)
The receive form walks the dock through the customer, part, quantity, packing slip, and photos.
Photos: as many as you need. The photo step used to be two fixed slots, which wasn't enough for customers who want the whole skid documented. It's now a single picker:
- Under Lot Photos, click the file picker and choose one or several photos at once (a phone or tablet can shoot them straight into it).
- Each one you add is listed by name, with a Remove link if you picked the wrong file.
- Add as many rounds as you like — there's no cap.
- At least one photo is required before you can submit.
Everything captured this way shows up afterwards on the lot's detail page under Receiving Photos, with a count. That gallery is read-only — click a photo to open it full size. If a receiving photo is wrong, it has to be corrected at receiving, not from the lot page.
Mission: Estimated Completion Date
Mission lots carry one extra planning date: Est. Completion Date (ECD). It's production's own estimate of when the lot will actually be finished, kept separate from the customer's due date so planning and the promise don't get confused.
- On the lot's detail page, Est. Completion Date appears with the other lot details and is editable in place.
- On the Lots list it shows as an Est. Completion column.
- This is Mission only. No other plant has the field, and it won't appear on their lots or lists.
Move a lot through the shop (transitions)
Drag a lot card between columns on the Kanban board, or open the lot and click Move to Next Stage, then confirm.
Quality gates can block a transition until the lot is clean:
| Gate | What it checks |
|---|---|
| QG1 — FAI | First Article Inspection is complete for a new product |
| QG2 — Risk | Risk mitigation is done when the risk score is over threshold |
| QG3 — Credit | The customer isn't on a credit hold |
| QG4 — Dims | Dimensional verification is recorded for coil products |
| QG5 — QC | The QC inspection has passed |
| QG6 — NCR | No non-conformances are open against the lot |
If a gate stops you, the lot detail page tells you which one and what's outstanding.
Print the traveler
The traveler is the paper packet that rides with the lot through the shop.
- Open the lot's detail page.
- Click View Traveler to open the PDF on screen, or Print Traveler to email it straight to that facility's Epson printer.
The traveler carries:
- Page 1 — lot details, barcodes (Code 128 + QR), the risk gauge, and FAI photos. For coil products it also prints the coil square footage and the number of clamps so the floor sets up correctly.
- Page 2 — the step-by-step process routing for that product.
Each reprint bumps the revision number, and the button shows the current one (e.g. "View Traveler · rev 2") so everyone knows which copy is the latest.
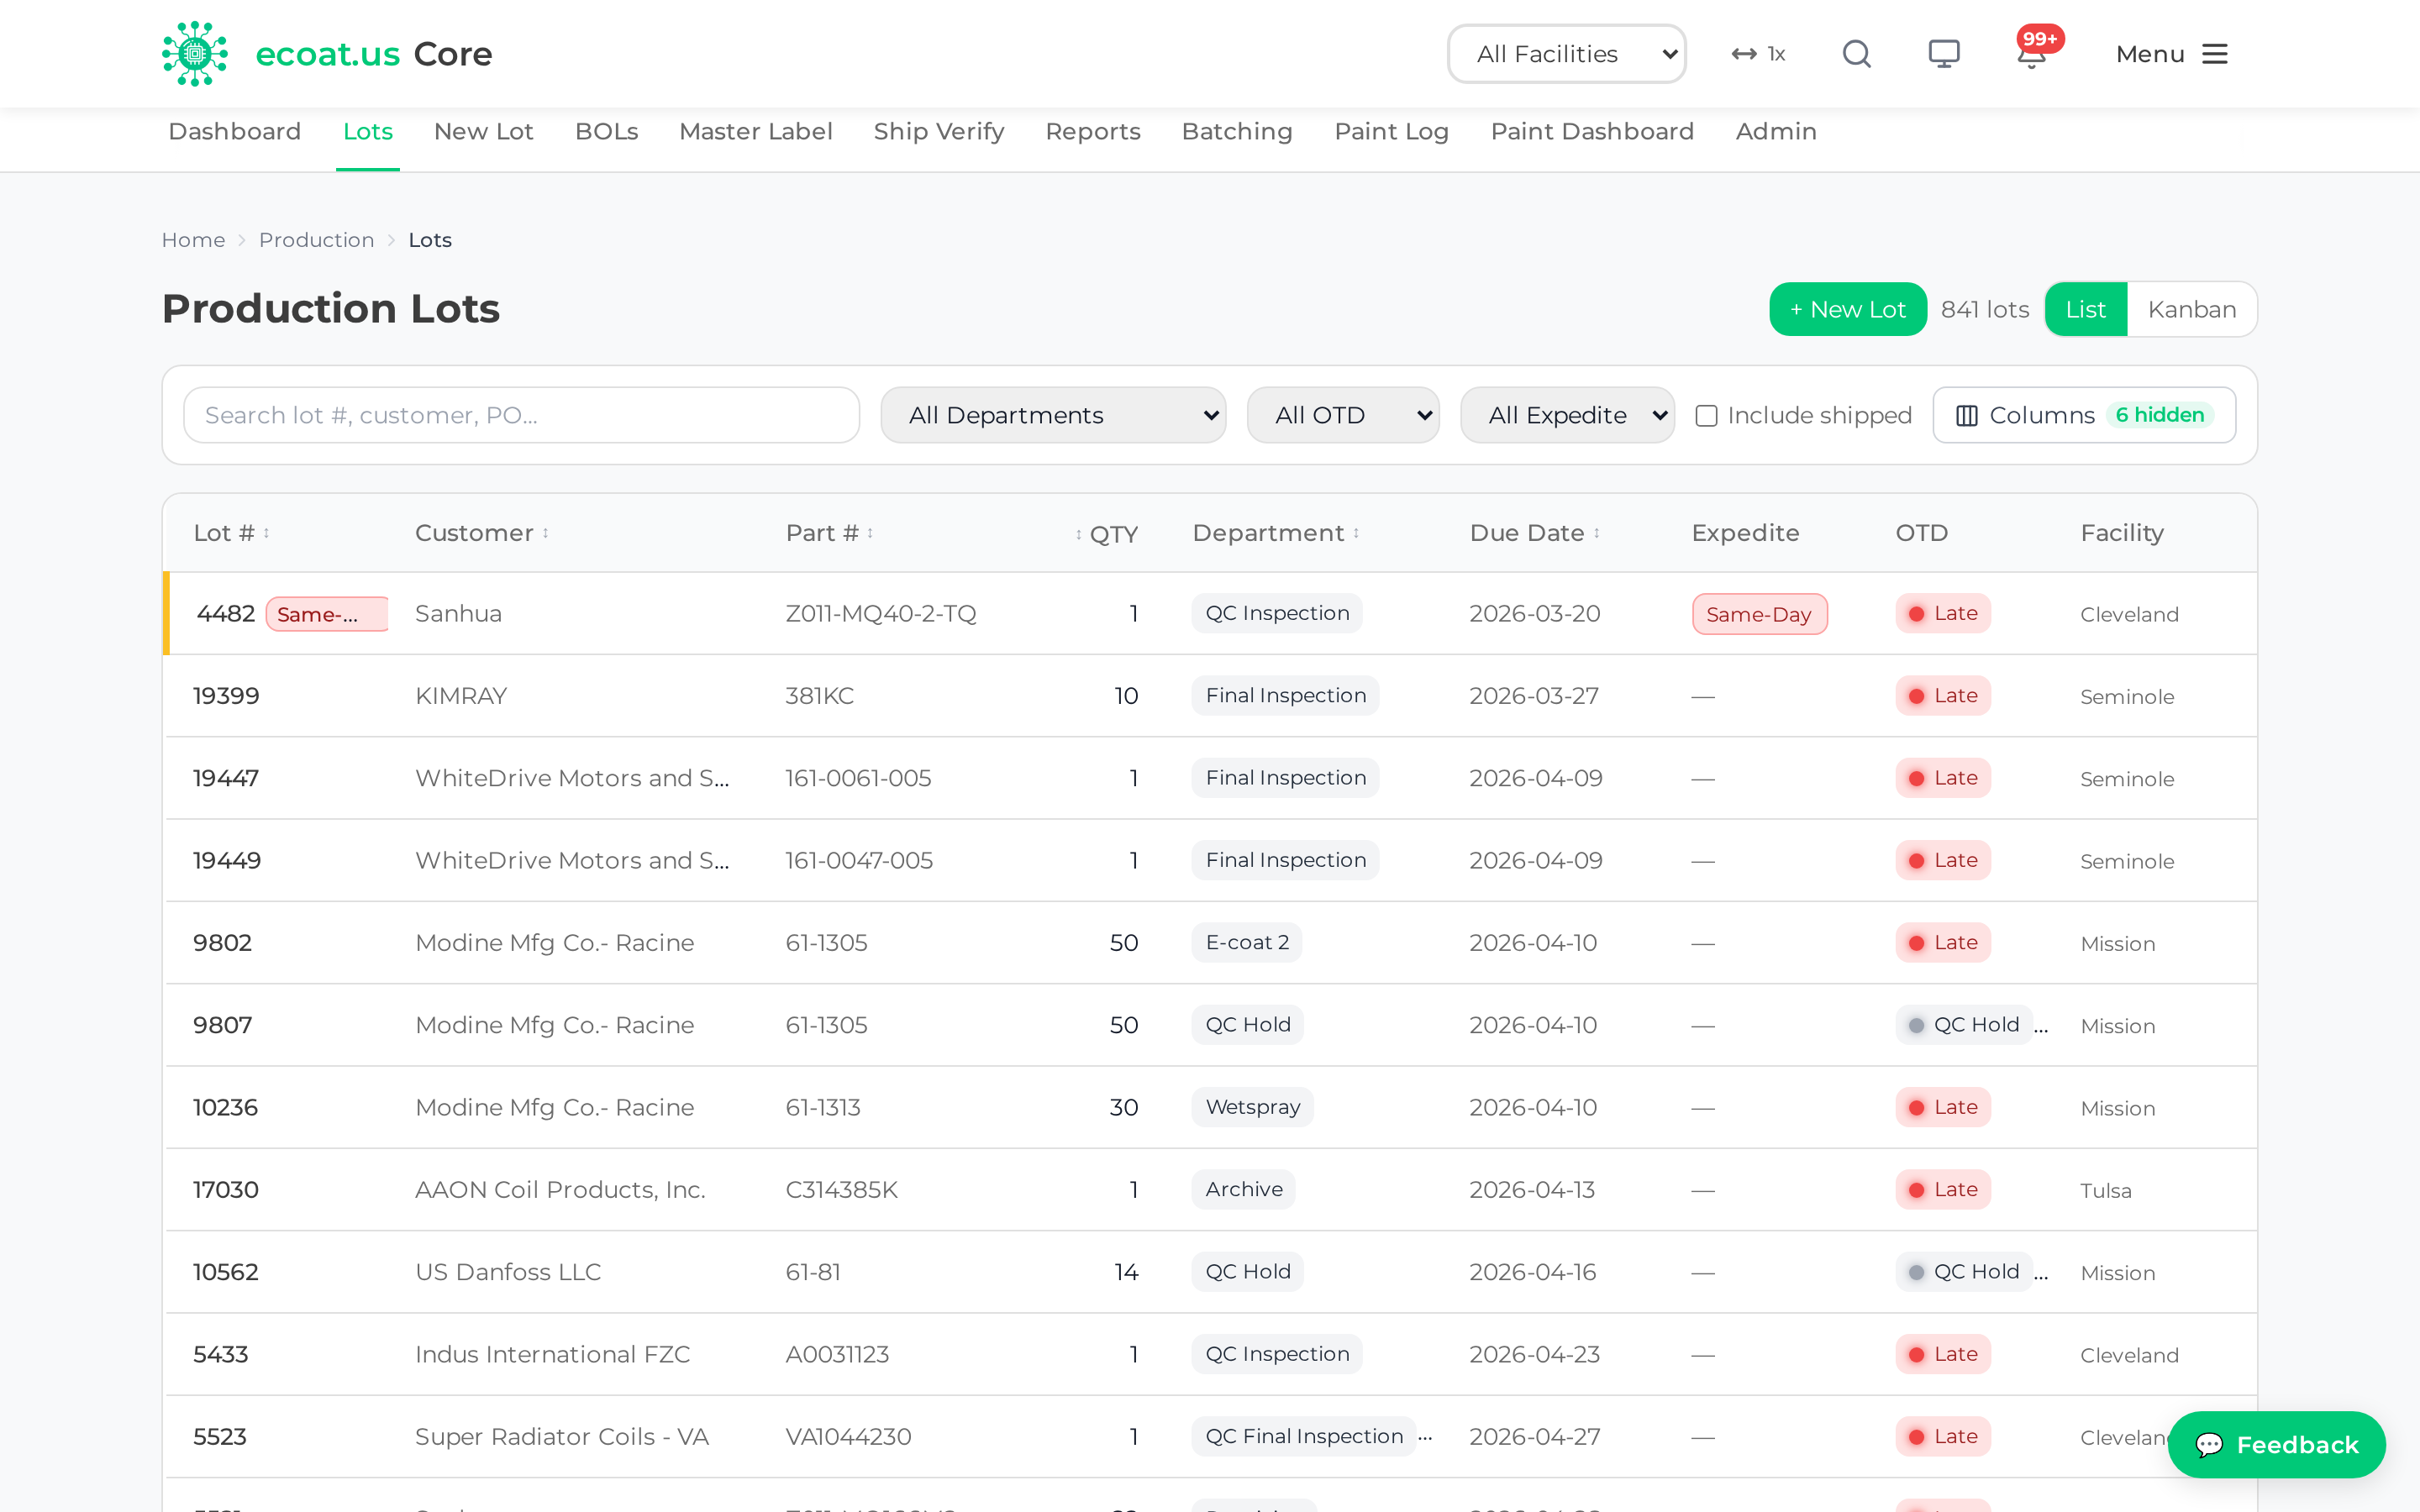
Scan the traveler QR
The QR code on the traveler is a live link to its lot. Scan it with any phone camera — no app, and no login needed — and you get the lot card: lot number, customer, part number, quantity, the department it's in right now, what's next, and the due date. An expedite is flagged in red across the top, and a shipped lot says so.
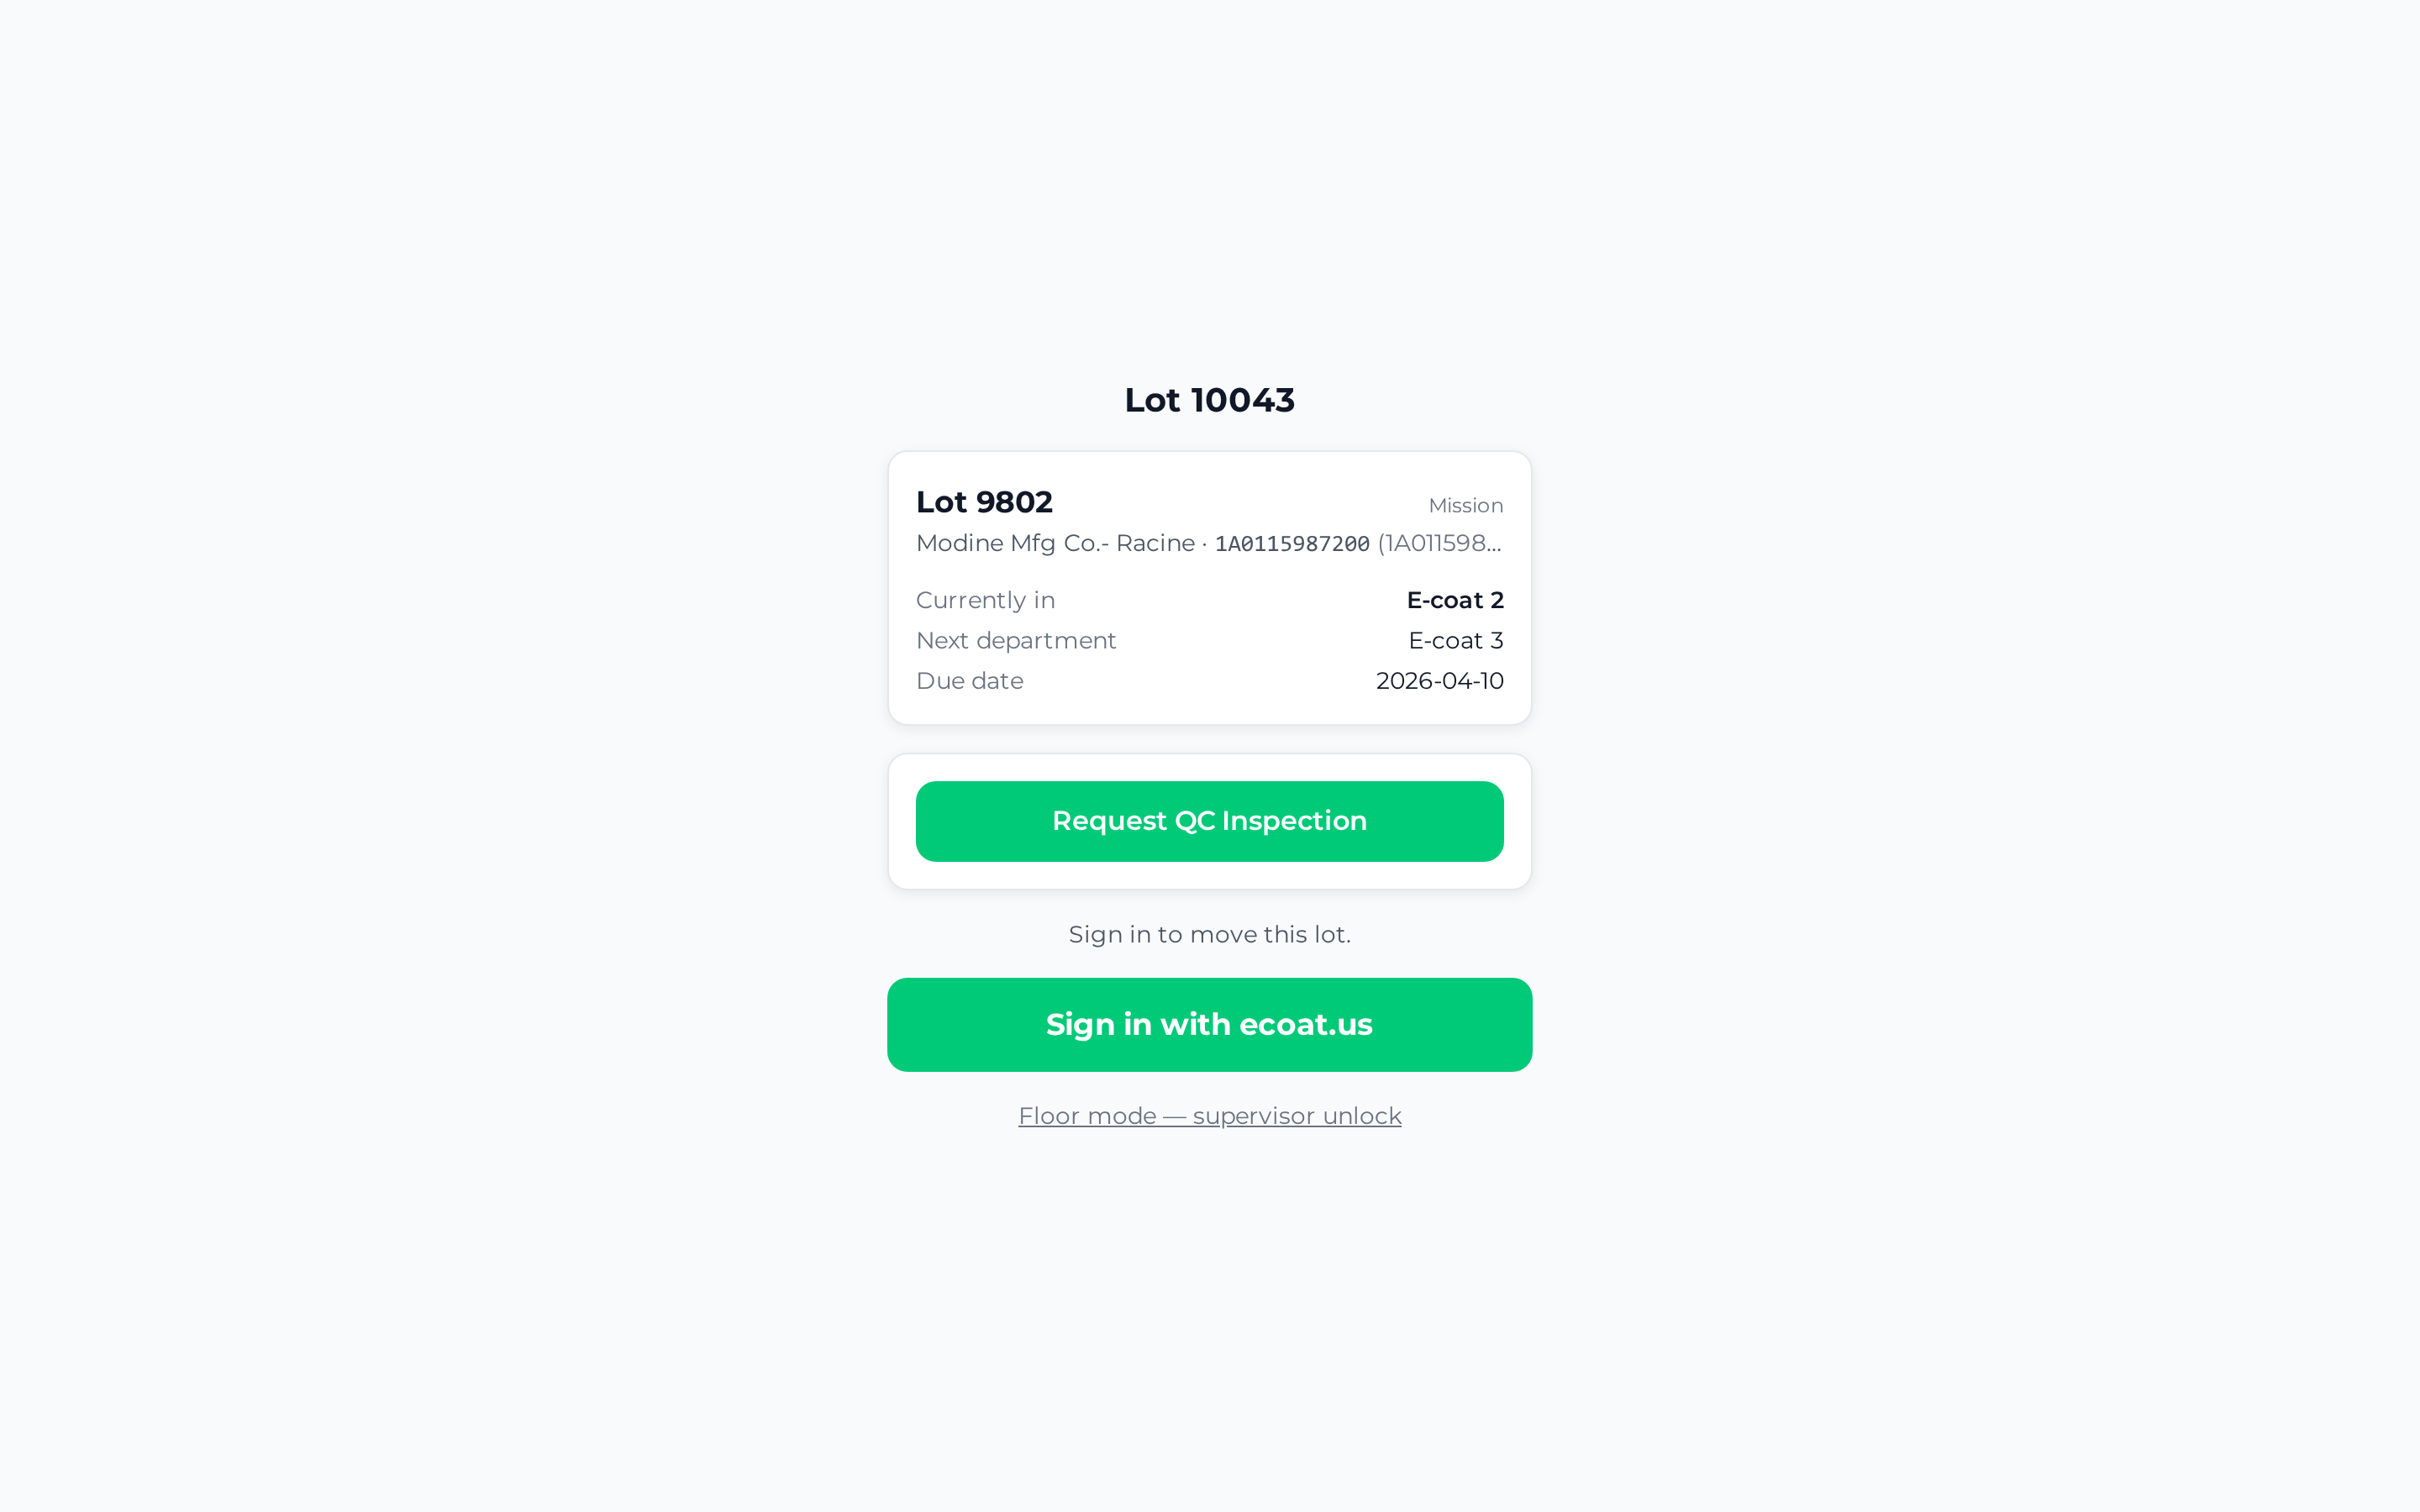
From that card anyone can ask for a QC inspection — a customer auditor, a temp, a driver. Click Request QC Inspection, type your name and what quality should look at, then Send to Quality. The request lands on the quality boards immediately, under your name, and clears itself once the inspection is recorded. If the lot already has an open request, the page says it's already on the QC board instead of filing a duplicate.
Signed in, the same scan does more:
- Quality sees Inspect this lot — one tap into a prefilled QC inspection.
- Shipping (the shipping group, or production supervisors) sees Add to shipment, which drops the lot onto a draft BOL or starts a new one — and a Verify shipment shortcut when the lot is on a shipment awaiting dock verification.
- Anyone with production access can move the lot through the shop from the scan page, quality gates included.
Parts Catalog
The Parts Catalog is the read-only list of every part number in the system, so production and shipping can look a part up without needing the admin-only Products tab.
- Go to Production → Production ▾ → Parts.
- Search by part number, alternate part number, or customer. The list is scoped to the facility in the top bar.
- Sort by any column, and read the type flags on each row — coil, ZPEX, ZPEX II, powder, CARC, general industrial, TCP, zinc phosphate.
- Click a row to open the part detail drawer with the full specs, including coil dimensions.
Archived parts are hidden. Most people only ever read this page; FAI editors can correct coil sizes from the drawer.
Shipping: Ready to Ship, Shipments, Ship Verify, and All Lots
Shipping is one hub with four tabs, walked in the order a truck actually loads: find what's ready, prep the BOL, verify the load — plus a master list for looking anything up.
Get there either way:
- Menu → Shipping — the top-level shortcut, for the shipping desk.
- Production → Production ▾ → Shipping — the same page from inside the module.
The tabs across the top are Ready to Ship, Shipments, Ship Verify, and All Lots. Whichever tab you're on is reflected in the address, so a link or a notification can drop you straight onto the right one.
If you're looking for "BOLs" or "Ship Verify" in the menu, they're not there any more — they became the second and third tabs of this hub. Their old addresses (/production/bol and /production/verify-shipment) still work, so saved links and bookmarks are fine; they simply aren't menu items, and they don't appear in Ctrl+K.
Tab 1 — Ready to Ship
The staging list: lots that are finished and waiting on a truck, for the selected facility.
- Search by lot #, customer, or part #, and filter by department or by final QC (All final QC / Passed final QC / Needs final inspection).
- Tick the lots going on this shipment.
- Click Create BOL, or Use Customer BOL if the customer supplies their own paperwork.
A lot that hasn't passed a final inspection can't be added to a BOL. Those lots still appear in the list, marked Needs final inspection, with a banner explaining why — they're shown for reference so you can chase the inspection, not so you can ship them.
Permissions: Creating a BOL requires the supervisor tier. Anyone with Production access can look at the list.
Tab 2 — Shipments (Bills of Lading)
A BOL is the shipping document that closes out one or more lots. Building one now runs through Pre-Shipping Prep — pick lots, build skids, print packing slips — and no Invoice # is asked for at any point. That's deliberate: invoicing moved to after shipment (see Invoicing, below), so the dock never waits on accounting.
The Shipments tab lists every BOL with its status — Draft, Confirmed, or Voided — and its prep chips: Prep complete, ASN sent, ASN via customer BOL, or Awaiting customer BOL with a day counter. Search by BOL #, customer, PO # or invoice, and use the Awaiting customer BOL filter pill to see only the shipments still waiting on customer paperwork.
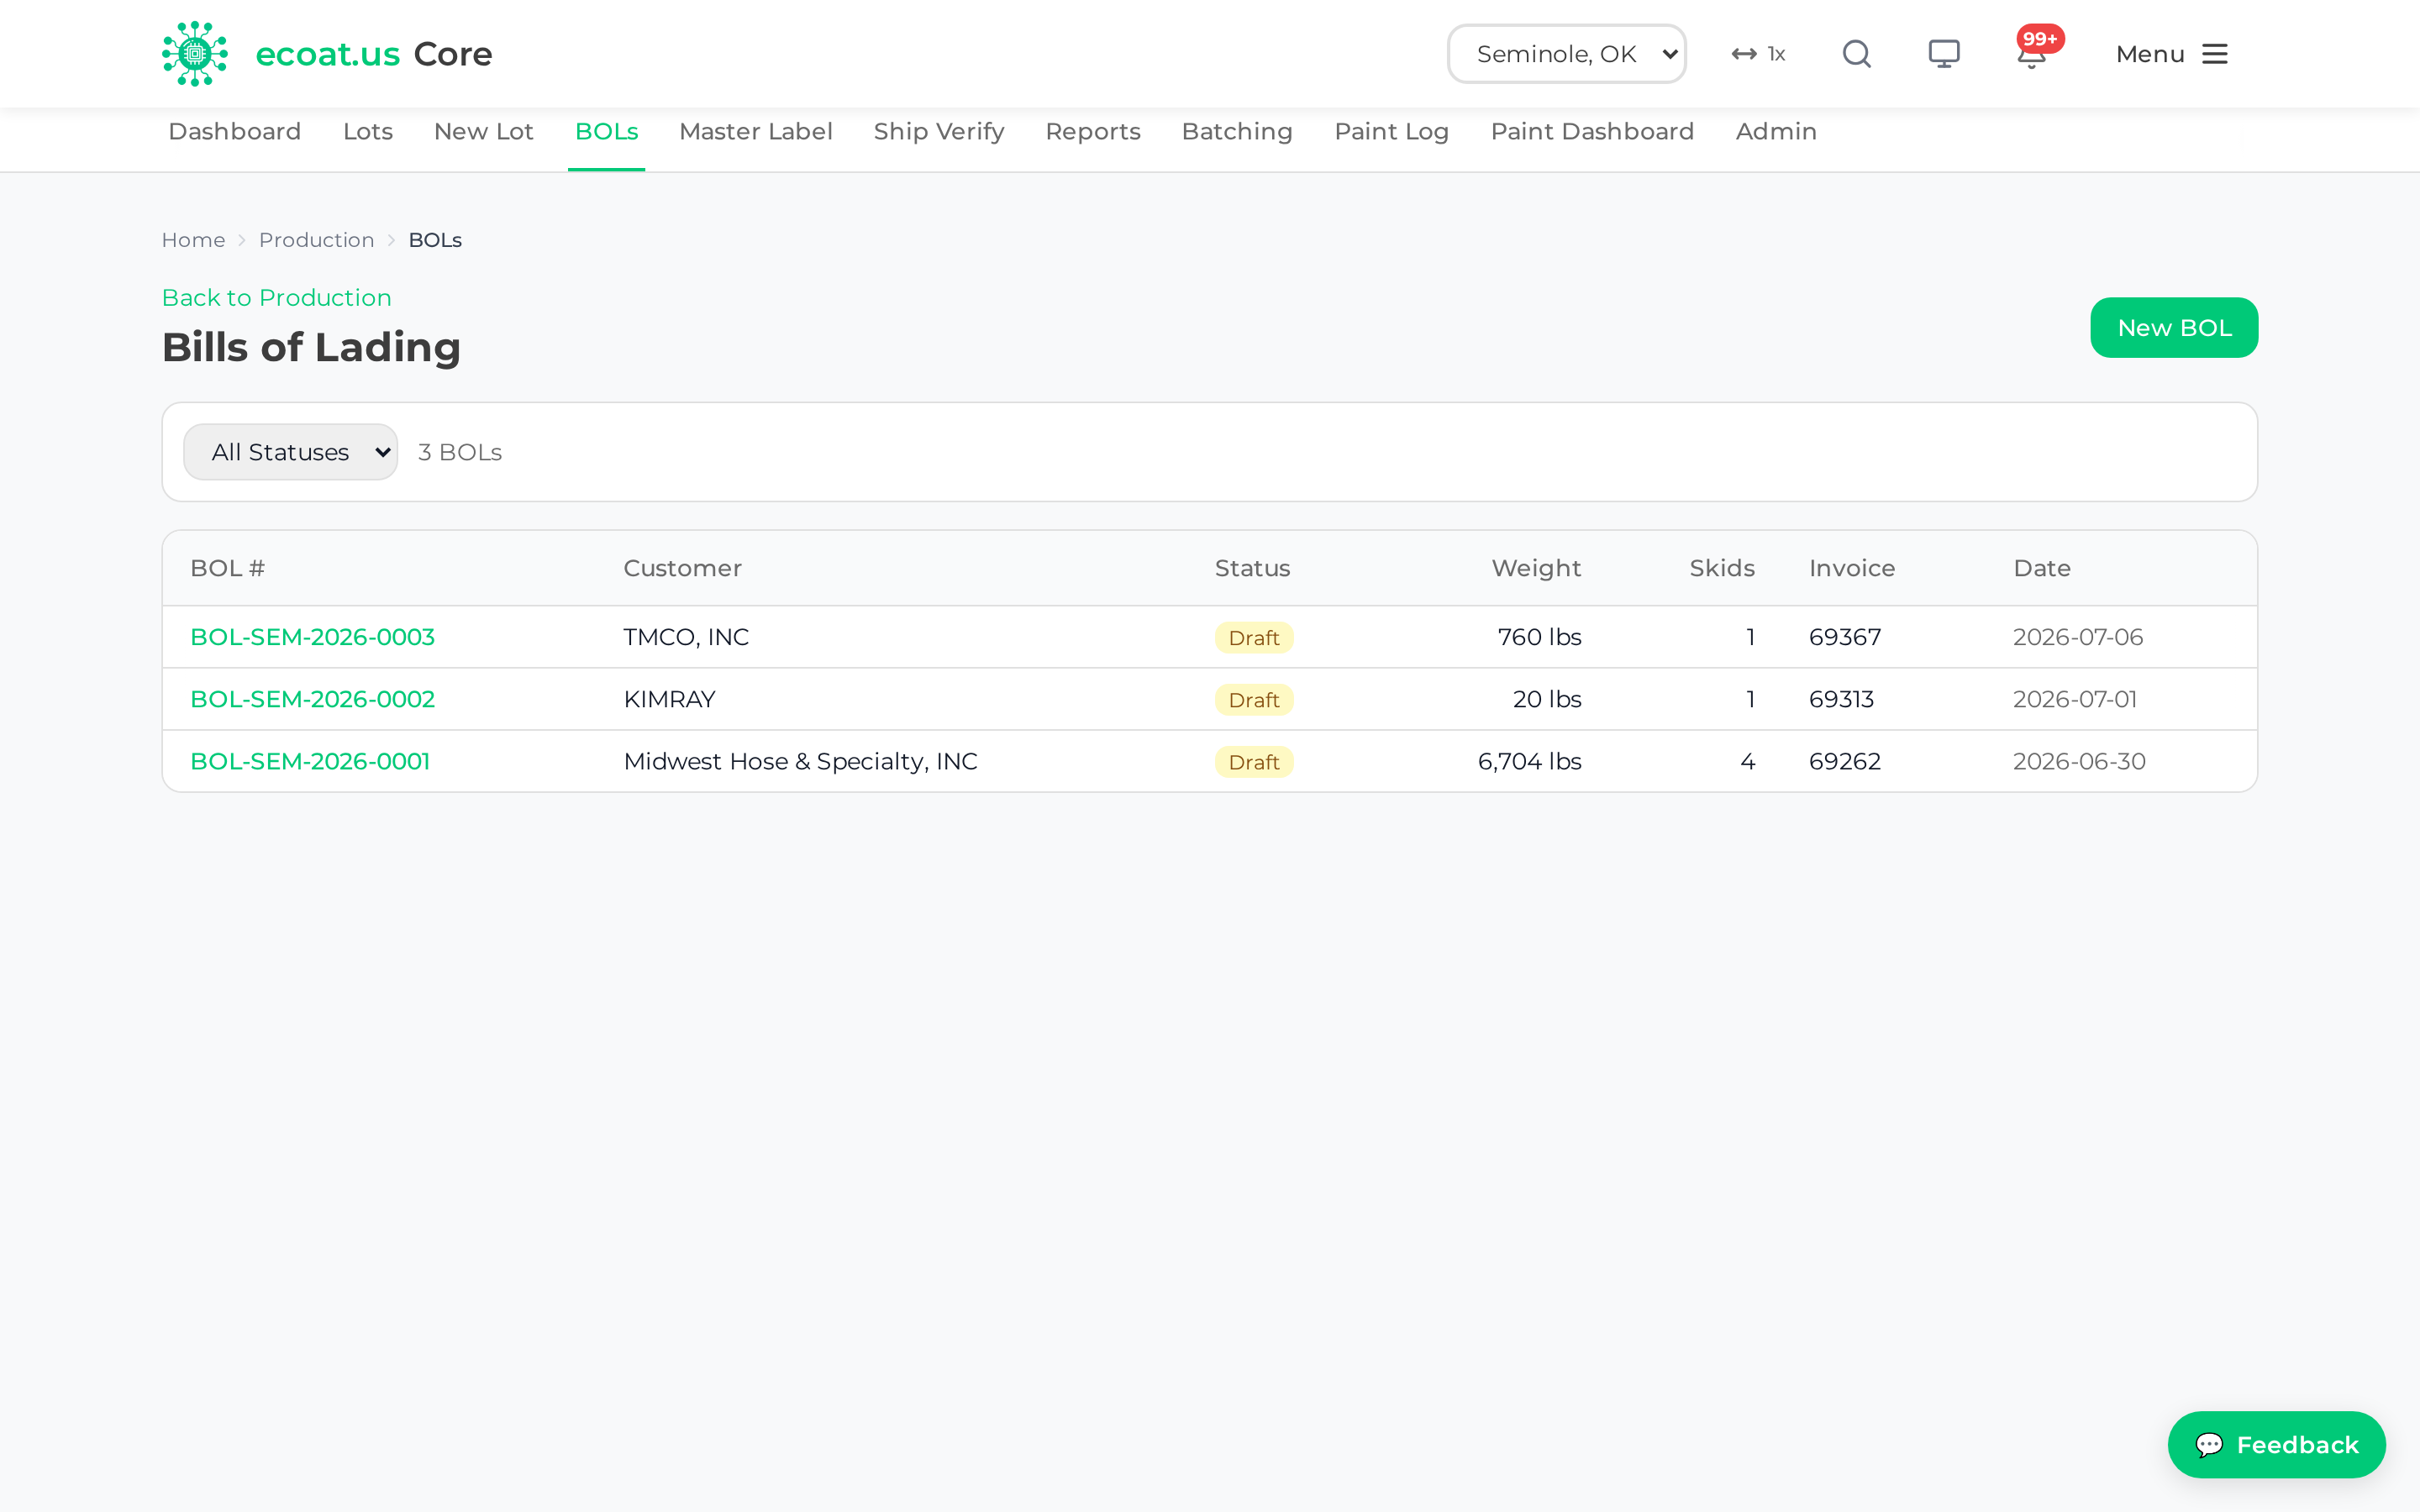
Pre-Shipping Prep — build the BOL
- On Ready to Ship, tick the lots and click Create BOL — or Use Customer BOL when the customer supplies their own paperwork. The Pre-Shipping Prep page opens with those lots already on it.
- Check the BOL type: ECOAT BOL, or Customer-provided BOL, which asks for the customer's BOL number and/or an upload of their document (image or PDF).
- Fill in the shipping details. The PO # is prefilled from the picked lots' POs, and every lot line's PO and Alt PN columns fill themselves — nobody retypes them. Shipping method, payment method, and the shipper contact are all optional.
- Build the skids. Use a preset — One skid per lot or Everything on one skid — or + Add skid and assign quantities by hand. Each line shows how much is left to place, and a skid holding more than a line's quantity blocks the save until it's fixed.
- Click Create Draft BOL, then Complete Prep. Completing prep locks in the skid layout, stamps the prep time, and unlocks Print Packing Slips — one packing slip per skid, ready to travel with the freight.
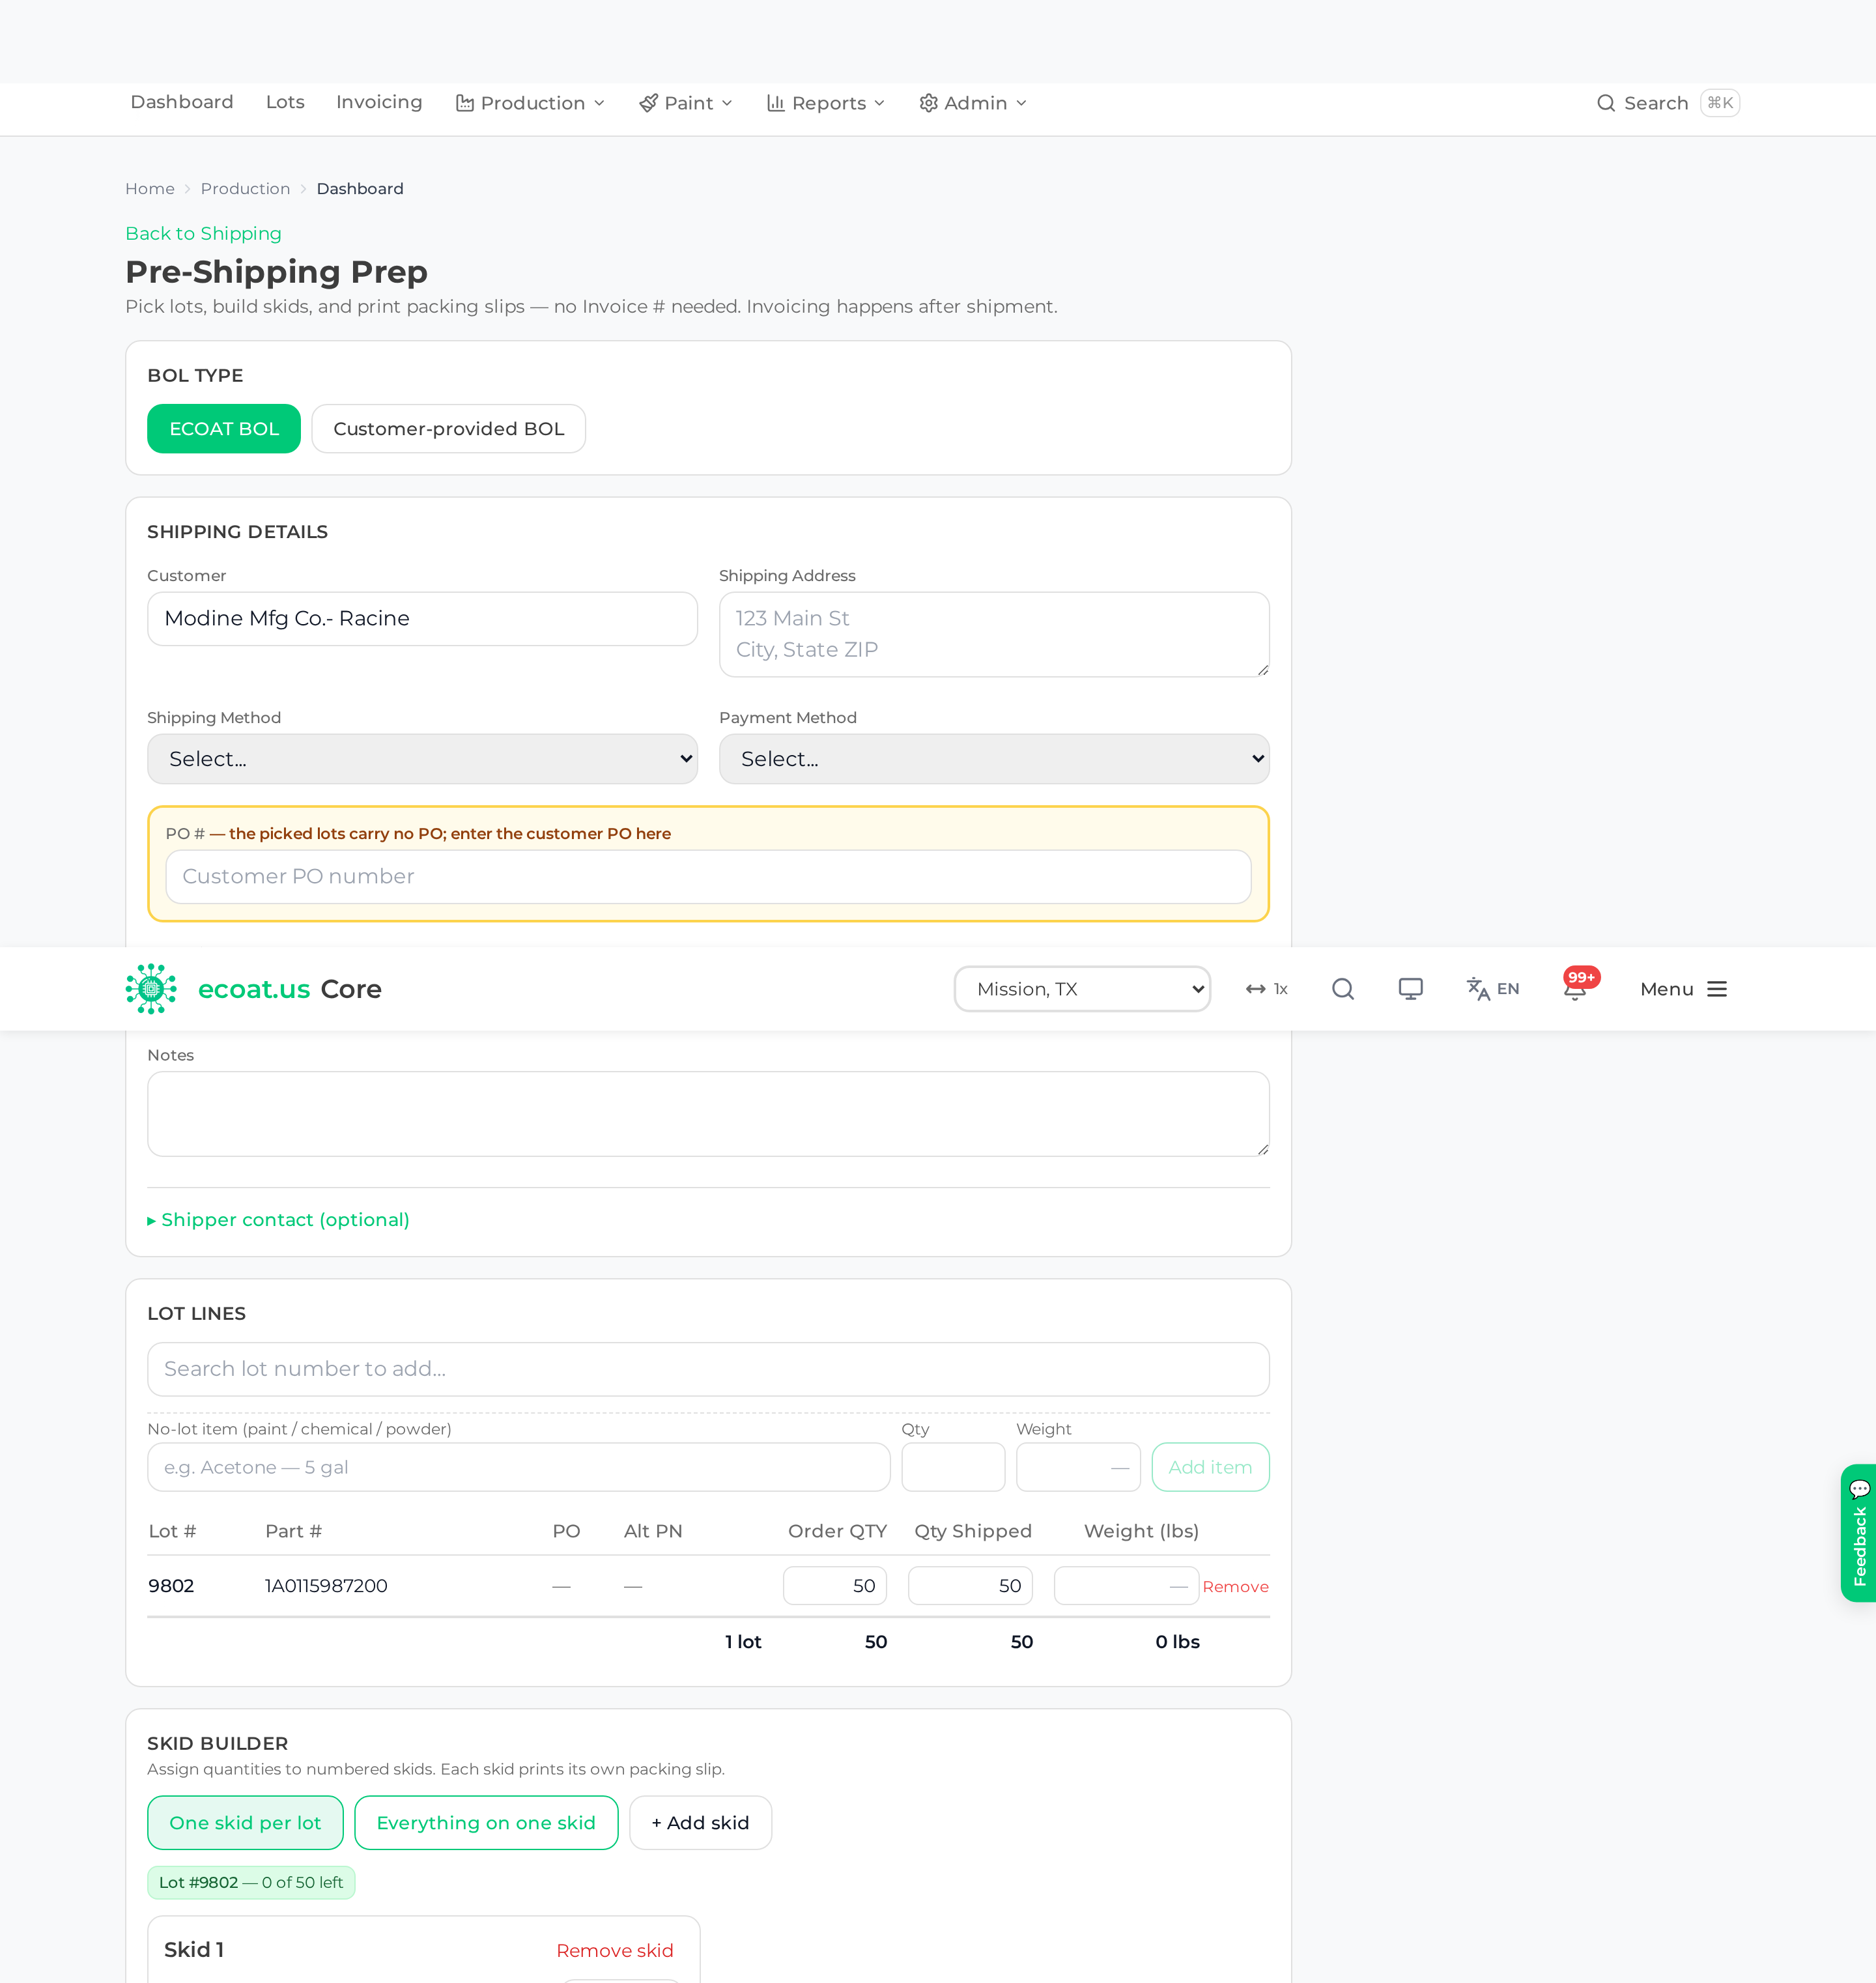
Note: Skids are optional. Complete prep without building any and Core defaults to one skid per lot — the packing slips print that way.
Confirming still ships it: Confirm Shipment on the BOL runs the quality gates against every lot and hands the shipment to the dock, and Ship Verify (photos + loader signature) is what actually ships the lots. For a customer-provided BOL the uploaded customer document is what's required before confirming — not an invoice.
ASN — telling the customer it shipped
Customers who require an advance ship notice (ASN) are tracked right on the BOL:
- A prepped shipment still waiting on the customer's paperwork shows Awaiting customer BOL with a day counter. It turns amber at 3 days, so nothing sits quietly.
- When the ASN goes out, click Mark ASN sent — Core records who sent it and when.
- Uploading the customer's BOL document counts as the ASN. The chip flips to ASN satisfied via customer BOL and no separate step is needed.
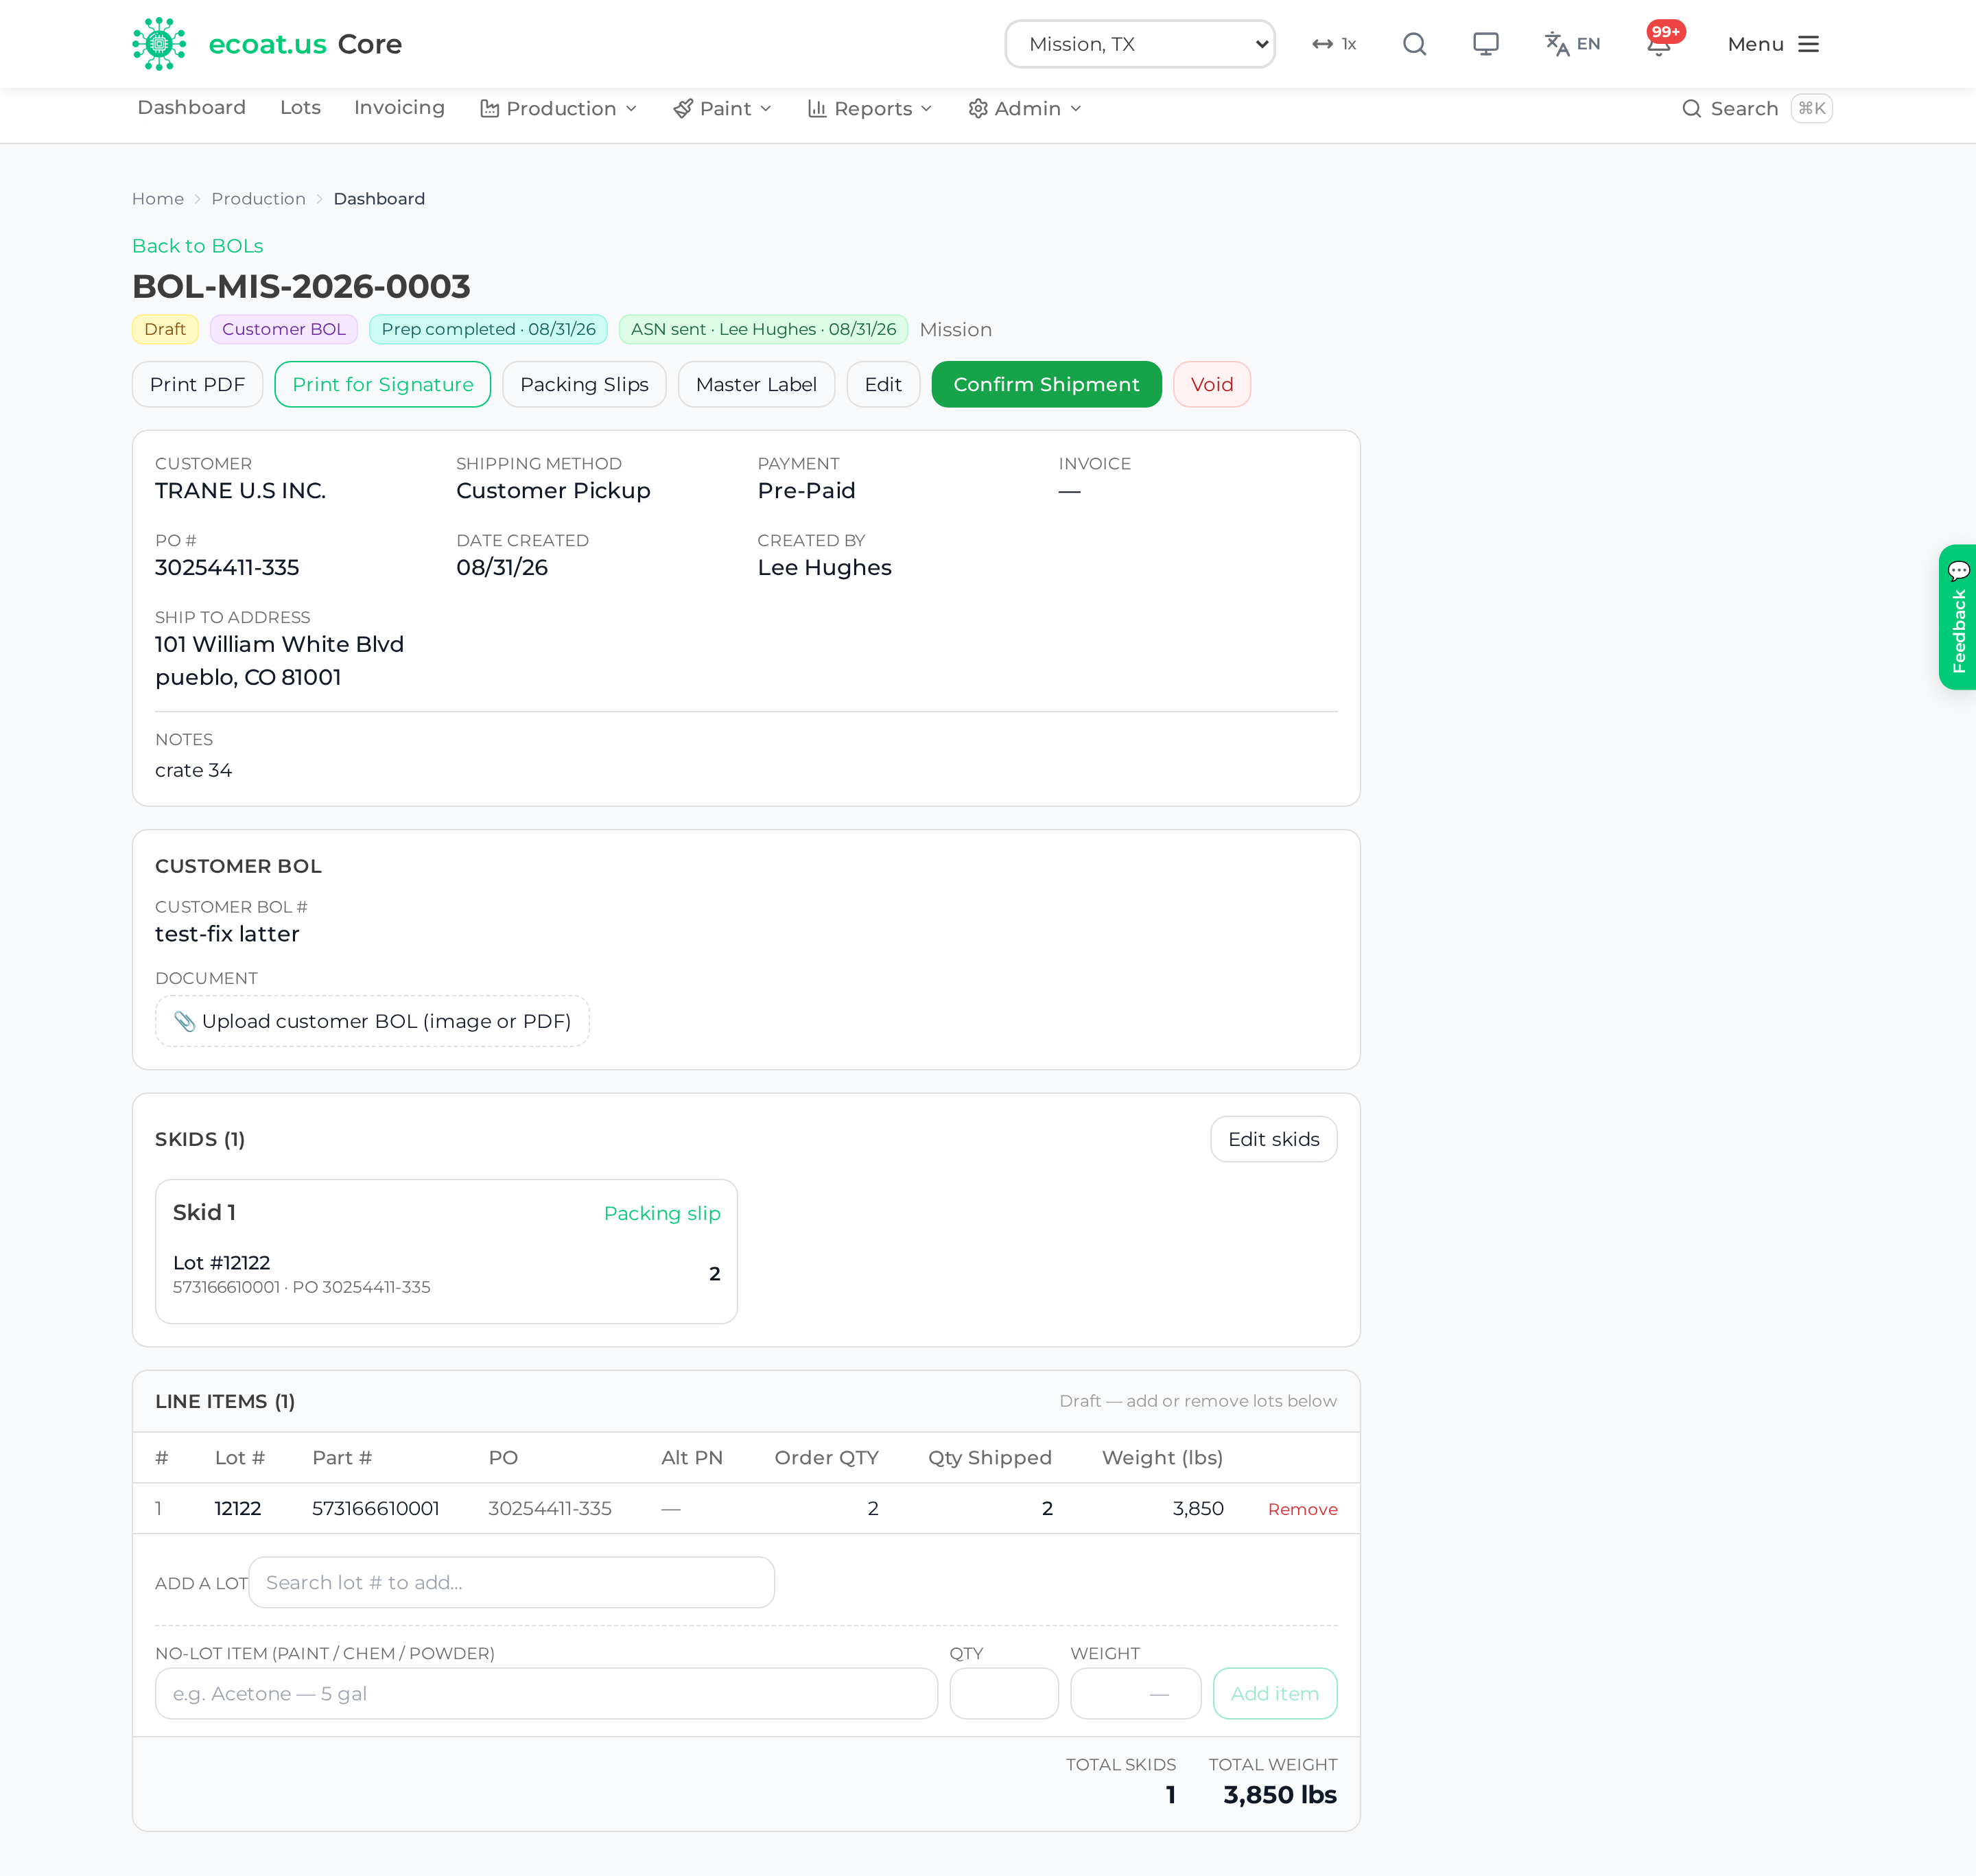
Tab 3 — Ship Verify
Ship Verify is the last check before a truck leaves — a photographed, signed confirmation that what's on the BOL is what's on the dock.
- Open the Ship Verify tab. It opens filtered to Pending verification; the dropdown also offers Verified and Voided.
- Find the shipment awaiting verification and click Verify →.
- Review the customer and line items.
- Take photos of the loaded shipment — up to 10. You can shoot a live photo or pick an existing one; a wrong photo can be removed while the verification is still Pending.
- Have the production supervisor sign.
- Submit — the status flips to Verified, stamped with who verified it and when.
At least one photo and a signature are required before the shipment can be completed. A verification can later be Voided if something was wrong, which is recorded too.
Permissions: Completing a verification requires the Production Supervisor tier. Without it you can open and read a shipment, but the photos and signature must be captured by a supervisor.
Tab 4 — All Lots
All Lots is the master list — every lot for the selected facility, shipped ones included, in one searchable table. It's the Core replacement for the old Baserow lot views, and it works at every plant.
- Search across lot, part, PO, customer; untick Include shipped to narrow to open lots.
- Click a column header to sort; the newest lots come first by default.
- Columns shows or hides columns — Skid ID, # Skids, Est. Completion, and FAS are there when you need them — and column edges drag to resize. Core remembers your layout.
- Export view downloads exactly what's on screen — current search, filters, and sort — as a CSV.
- Click a row to open the lot's detail page.
Invoicing
Invoicing is where accounting turns shipped BOLs into Xero invoices — after the truck leaves, not before. Core watches every shipment and queues it the moment it's billable. Open it from Production → Invoicing.
Permissions: The page needs invoicing access (the accounting team and admins). Without it the menu item doesn't appear, and typing the address just returns you to the dashboard.
Three tabs:
- Ready — shipments that can be invoiced now: shipped (dock-verified) or their ASN sent, every lot past final inspection, and not yet invoiced. The Ready column counts the days each has waited — amber past 3, red past 7.
- Blocked — shipments not billable yet, each with the reason: Awaiting ship/ASN, or Awaiting final inspection with the lot numbers to chase.
- Invoiced — everything raised or recorded, searchable, with each invoice's live Xero status.
Click a row to see the shipment's lines. Two buttons act on a Ready row:
- Create draft — builds a draft invoice in Xero for the shipment. The preview groups lines by PO and prices them from the Parts Catalog; a line with no catalog price gets an editable price box, and prices you type can be written back to the catalog so the next invoice knows them. The draft lands in Xero for accounting to review and authorise — Core never sends an invoice on its own.
- Record invoice # — the invoice already exists in Xero? Enter its number and Core verifies it, links it to the shipment, and files it under Invoiced.
Mapping customers to Xero
Creating drafts needs to know which Xero contact each customer is. A Ready row for an unmapped customer says Customer not mapped — click Map customer to open Customer to Xero Mapping (at /admin/customer-xero) with that customer already looked up. Search the Xero contacts and click the right one; the mapping saves immediately, once per customer, and every later shipment for them is covered. Record invoice # works even without a mapping.
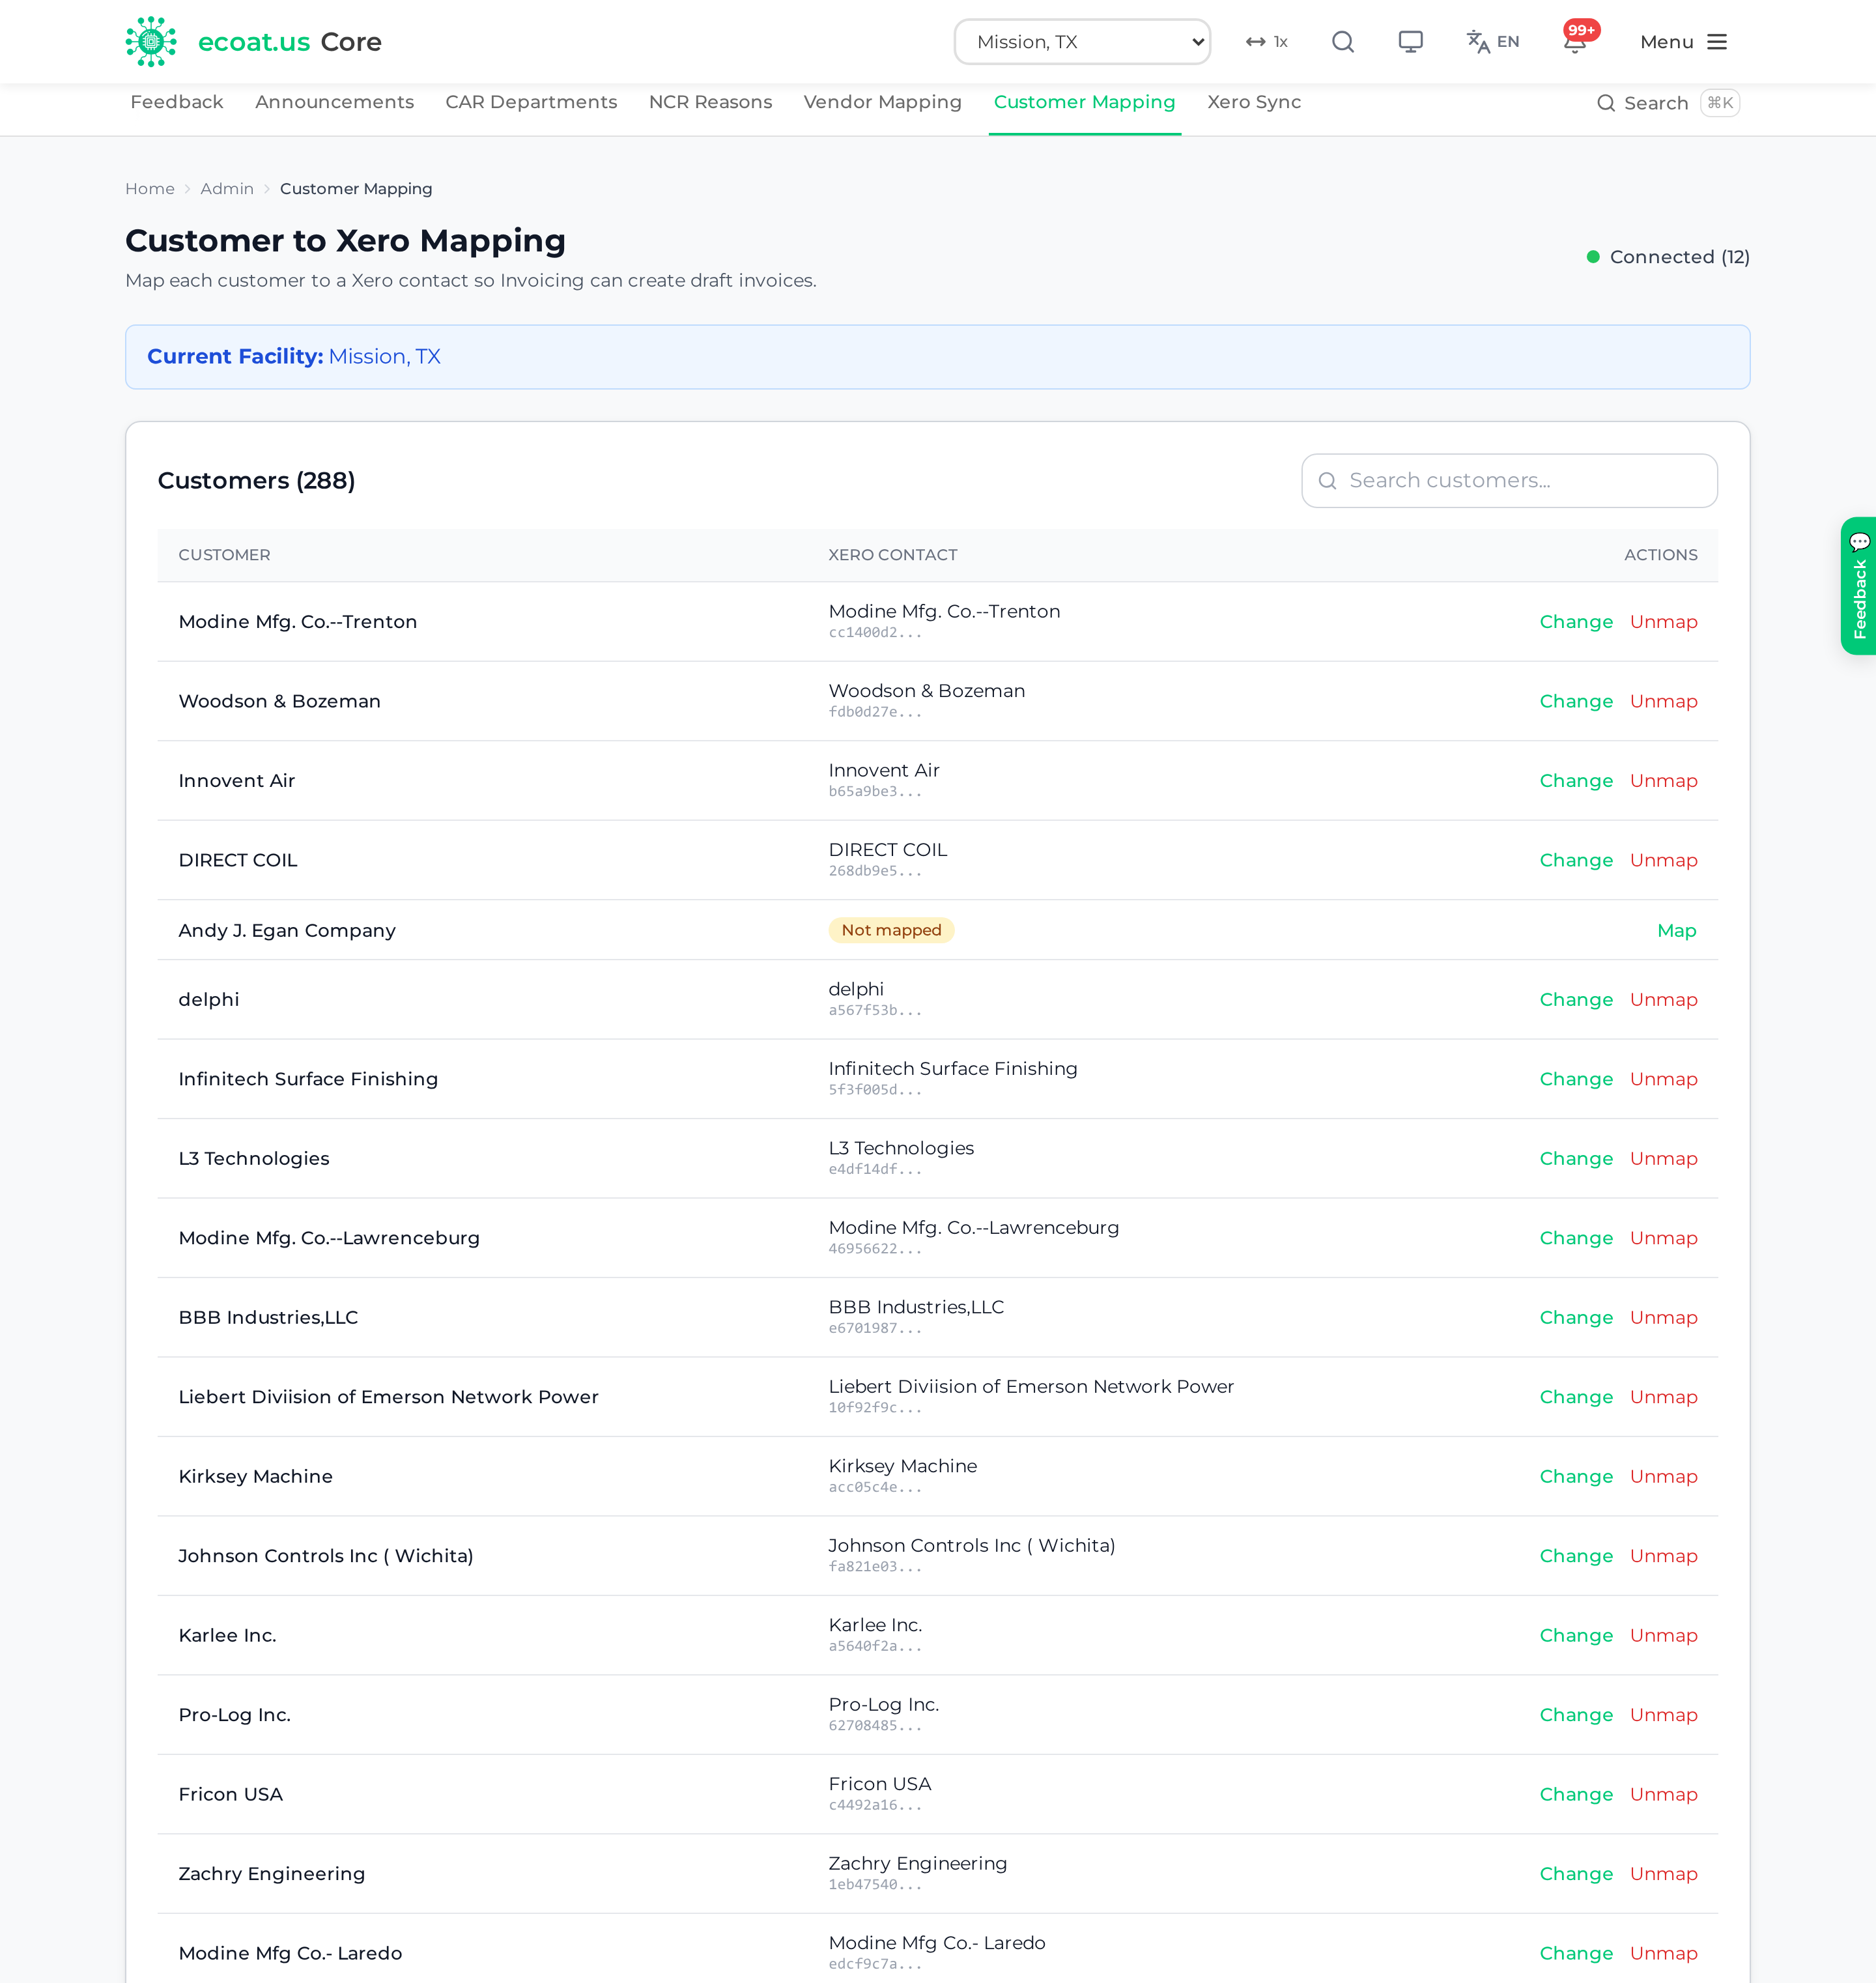
Master Label
Master Label prints the customer-specific shipping label (currently the Modine master label format) for a finished shipment.
- Go to Production → Production ▾ → Master Label.
- If you launch it from a BOL (via a
?bol=link), it opens in Auto mode and fills the header for you. Otherwise it opens in Manual mode. - Confirm or enter the header fields: From / To block, Modine part number, description, lot number, ship date, ASN.
- Add a row per pallet with its piece count.
- Generate and print the label PDF.
Permissions: Master Label requires the supervisor tier.
Reports
Reports turn the floor's activity into trends so you can see where time is being lost.
Go to Production → Reports ▾ → Reports for:
- On-Time Delivery (OTD) — the percentage of lots shipped on or before their due date, month by month.
- Active Lot Aging — how long current lots have been open.
- Department Bottleneck Analysis — the average days lots spend in each department, so you can spot the slow stage.
- Rework Events — Strip, Recoat, and other rework, grouped by cause.
Everything is scoped to the facility selected in the top bar. Empty charts ("No data available") just mean nothing matched for that facility and period.
OTD — the monthly delivery review
OTD is the month-by-month on-time delivery review — one row per lot due in the month, with verdicts, loss root causes, and notes. It replaces the old spreadsheet-and-form routine. Open it from Production → Reports ▾ → OTD.
Note: OTD tracking currently runs for Mission. If another plant is selected, the page says so — switch the facility selector to Mission to review it.
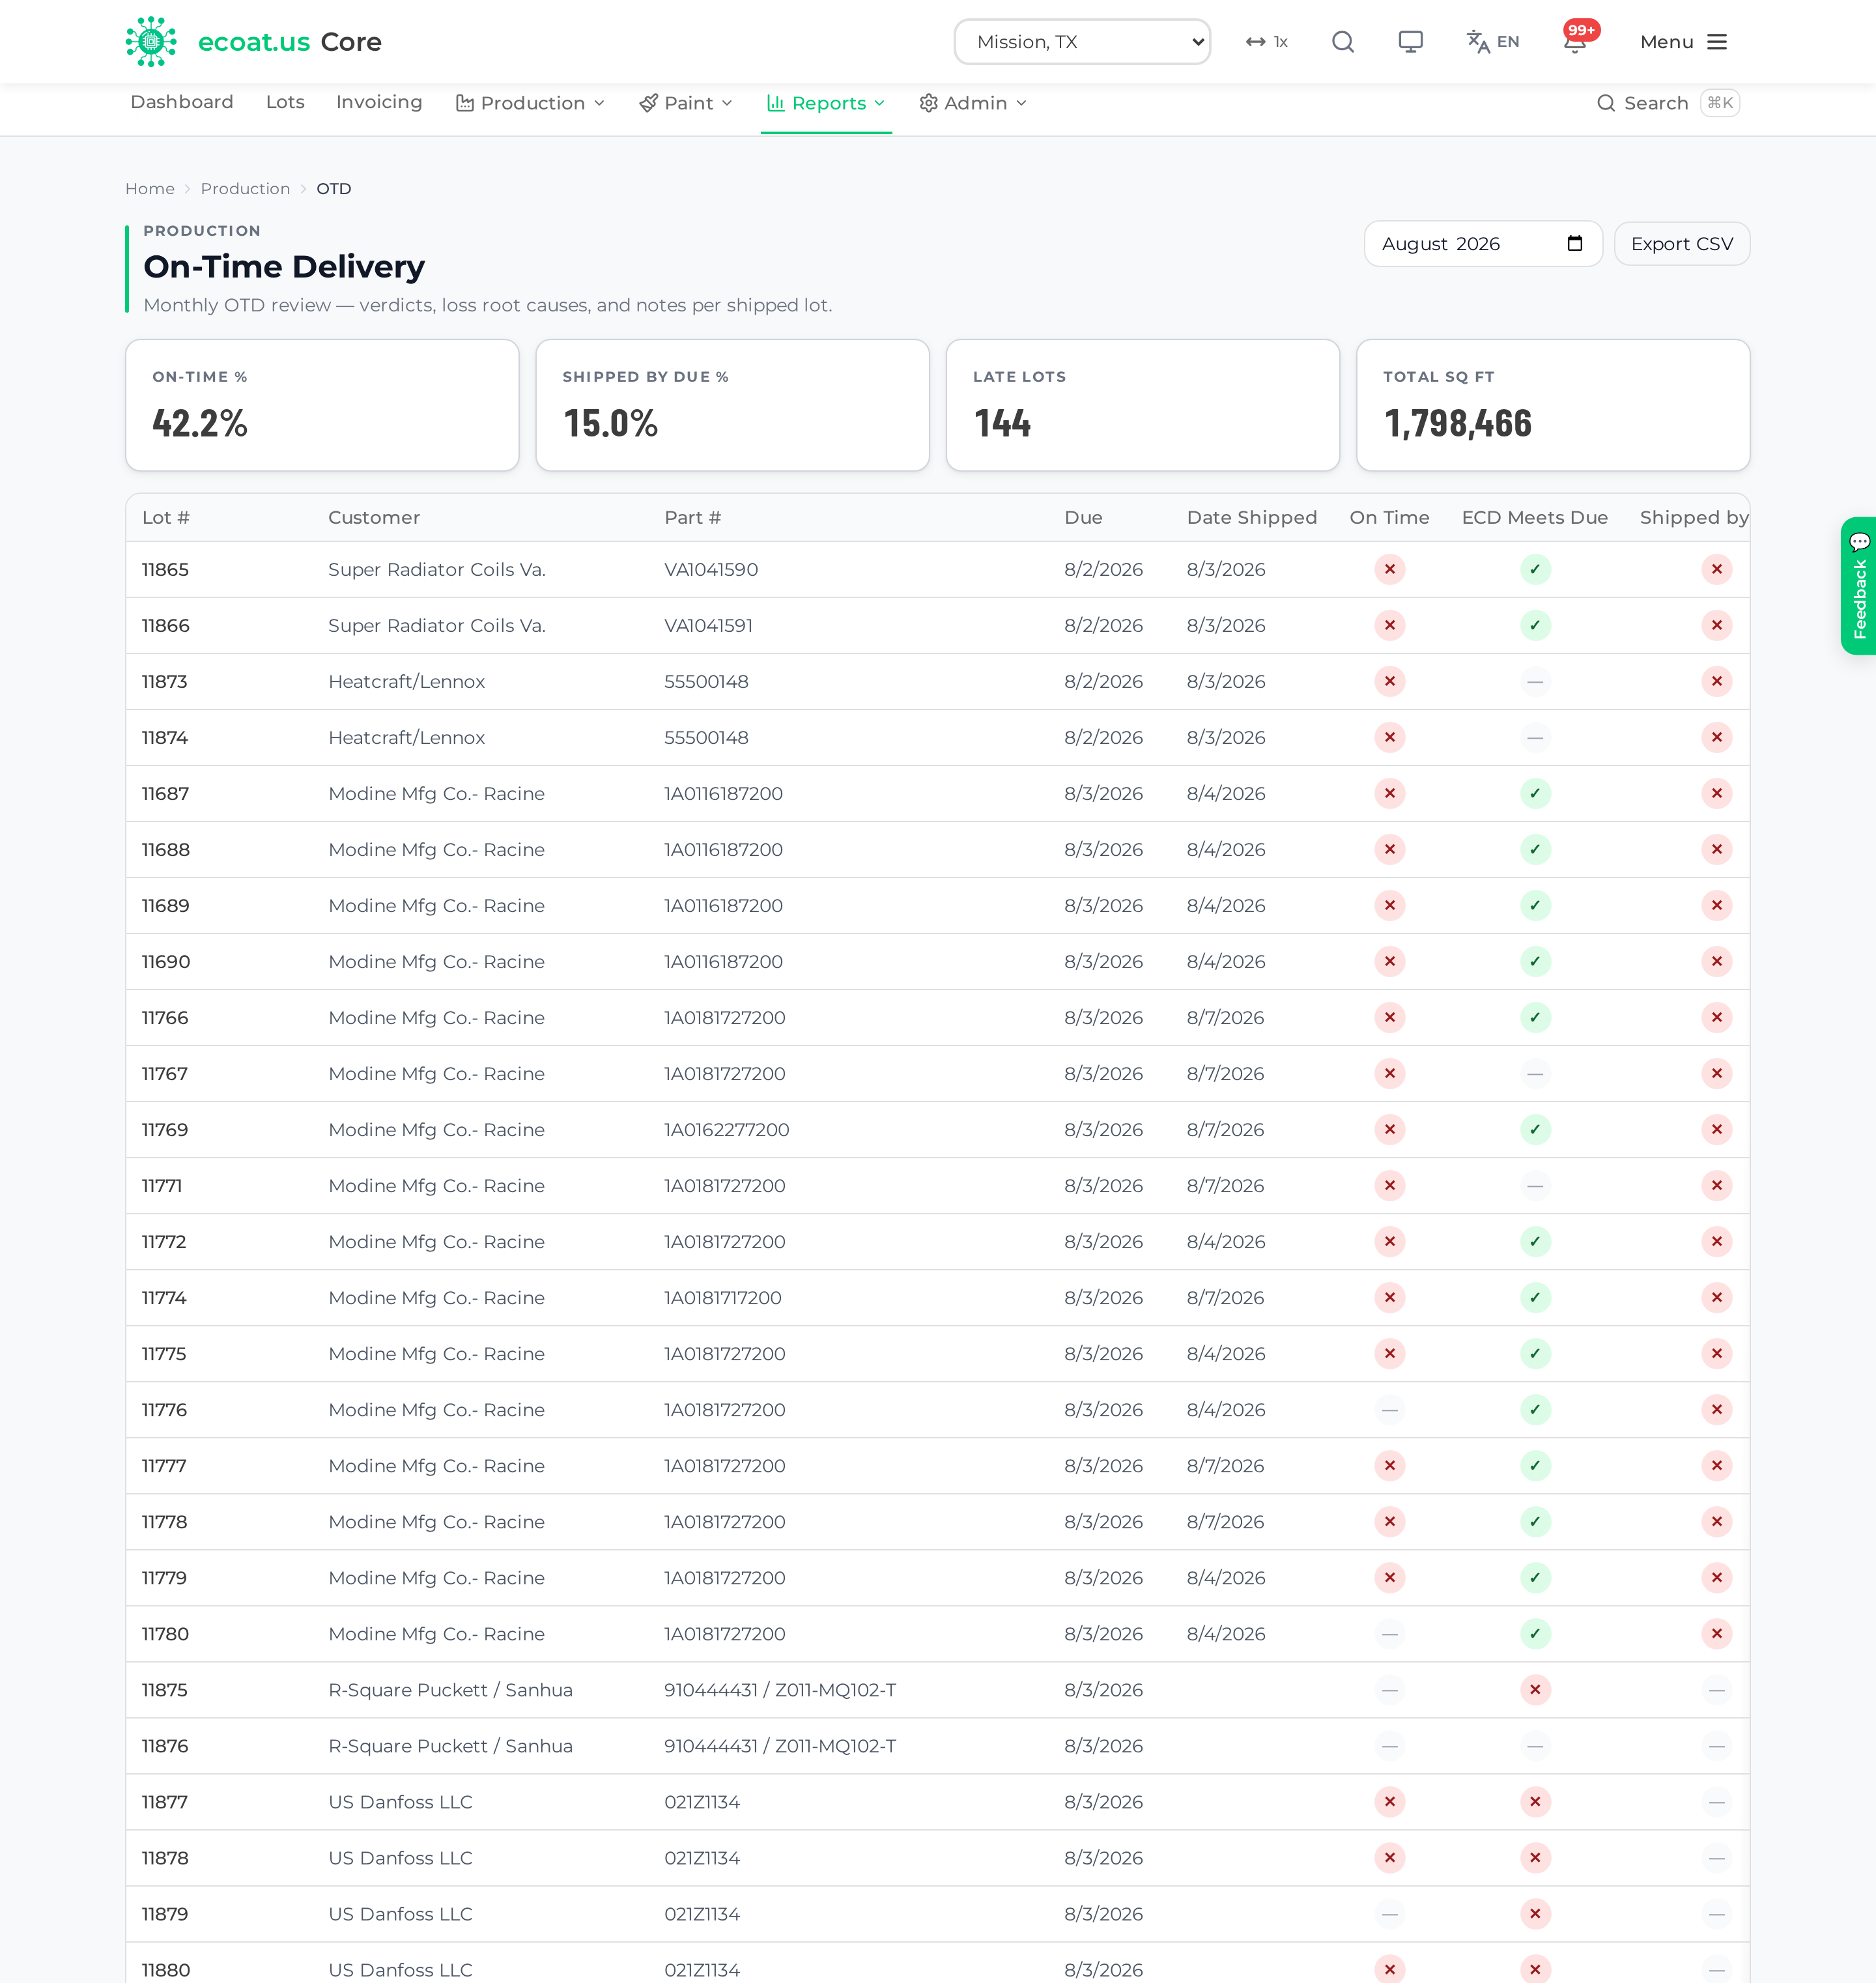
- Pick the month at the top; the table windows on each lot's due date.
- Four cards summarise the month: On-Time %, Shipped by Due %, Late Lots, and Total Sq Ft.
- Every row shows three verdicts — On Time, ECD Meets Due, and Shipped by Due — as a green check, a red cross, or a grey dash when the dates to decide aren't recorded yet.
- A late lot with no explanation is flagged Needs reason — pick its Loss Reason right in the row and add a note. Edits save as you make them.
- A lot with an open NCR or sitting in QC Hold shows an Excluded chip: it stays visible, but it doesn't count toward the month's percentages.
- Export CSV downloads the month exactly as shown.
Permissions: Anyone with Production access can read the review. Setting loss reasons and notes takes the shipping group or a production supervisor — for everyone else the controls are visible but greyed out.
Batching
Batching groups your unshipped lots by paint colour and process so the floor can rack jobs by paint changeover instead of purely by due date.
- Go to Production → Production ▾ → Batching.
- Lots are grouped by (process, colour). Each group shows its lot count, total quantity, and the earliest due date.
- The colour chip on each group matches the identity stripe on the traveler, so a rack of the same colour is easy to spot.
This page is read-only — it's a planning aid, not a place to move lots. Batch the racks it suggests, then move the lots through their stages as usual.
Tip: Running the same colour back-to-back saves a paint changeover. Use this view first thing in the morning to plan the day's paint sequence.
Paint Log
The Paint Log is the office window into what the paint kiosk recorded on the floor. Painters log their mix sessions at the shop-floor kiosk; this page lets office staff review them.
- Go to Production → Paint ▾ → Paint Log.
- Browse the list of paint-mix sessions.
- Click a session to open its detail, including material genealogy (which containers went in) and lot chain-of-custody (which lots the paint went to).
This is a read surface — you review here; the mixing itself happens at the kiosk.
Paint Dashboard
The Paint Dashboard reports paint usage and waste per facility, month by month.
- Go to Production → Paint ▾ → Paint Dashboard.
- Pick a month; the facility comes from the top-bar selector.
- Review the KPI row, the paint-by-product breakdown, the daily paint vs waste trend, and operator activity.
It combines the new Core paint log with the older legacy paint log. A source-split badge shows how much of the data is new vs legacy, and there's an always-on link to the read-only Legacy Paint Log archive for older entries.
Processes
Processes are the routing recipes — the ordered steps a given product follows through the shop, which print on page 2 of the traveler.
There is no Processes item in the menu. Reach the Process Management page either way:
- Click the Processes button in the top-right of the Production Dashboard, or
- Go to Production → Admin ▾ → Admin and open the Processes tab (admins only).
The direct address /production/processes still works if you have it bookmarked, but it won't turn up in Ctrl+K.
Once you're there:
- Filter by department or type.
- Click a process to see its steps — each with a step number, detail, the responsible department, whether testing is required, and any linked documentation.
- A process can be marked Use as FAI Process Template so new First Article Inspections start from a known-good routing.
Permissions: Editing processes and other master data lives under Production → Admin ▾ → Admin, which requires the admin tier. Most users only ever view.
Production Admin
Production → Admin ▾ → Admin is the master-data desk for the facility picked in the top bar. It requires the admin tier, and it works one facility at a time — switch facilities in the top bar to edit another plant's tables. The tabs are Customers, Processes, Products, Employees, Printers, and ZNET Recipes.
ZNET Recipes
ZNET Recipes are the e-coat presets for the ZNET rectifier — the named settings an operator picks instead of dialling numbers in by hand.
- Go to Production → Admin ▾ → Admin and open the ZNET Recipes tab.
- Click Add Recipe, or edit an existing row.
- Each recipe carries:
| Field | Meaning |
|---|---|
| Name | what the operator sees when picking a recipe |
| Volts SP | voltage set point |
| Amps SP | amperage set point |
| Ramp (s) | ramp time in seconds |
| Active | only active recipes surface in the ZNET module |
| Sort | the order they're listed in |
| Notes | free text for anything the numbers don't say |
ZNET plants only. The tab is there for Tulsa, Mission, and Cleveland — the plants with a ZNET database. Select any other facility and the tab tells you there's nothing to configure.
Kanban Kiosks (plant-floor displays)
The Kanban Kiosk is the Production Kanban board running full-screen on a shop-floor display — a dark "control-room" view of the lots at a station, so the floor can see and move work without signing in.
- It lives at
/production/kanban/kioskand authenticates with a device token stored on that display, not a user login. Moves it makes are attributed to the station's name. - It refreshes every 60 seconds.
- Two options can be baked into the display's home-page address:
?tvsizes it for a 4K wall screen, and?readonlyturns off moves entirely — the right choice for a monitor with no keyboard or touch.
Setting a display up (admins)
- Go to Production → Admin ▾ → Kanban Kiosks.
- Mint a kiosk for its station and facility. Core shows a one-time enrollment link.
- Open that link once on the physical display. It enrolls the device and stores its token; from then on the display just needs its own address.
- The admin list shows every station with its last seen time, and flags one that has gone quiet — the fastest way to spot a display that has been unplugged or has lost the network.
- A station can be deactivated when it's retired, or its token rotated if the device is replaced or compromised.
Permissions: Provisioning kiosks requires the admin tier. The kiosk display itself needs no login at all — which is exactly why an unused station should be deactivated rather than left enrolled.
QC Queue TV
The QC Queue TV is a wall-mounted dashboard for the quality team — a dark, distance-readable screen showing every lot waiting for QC inspection, oldest first, with time-in-stage and SLA colouring.
- It runs full-screen with no login on a shop TV, opened at
core.ecoat.us/production/qc-queue-tvwith the display key in the address. - It refreshes every 30 seconds and shows a DISCONNECTED indicator if it loses the server.
- When there's nothing waiting, it reads QC queue clear.
Permissions: This is a display-only screen authenticated by a fixed TV token, not a login. There's nothing to click — it's for watching, not acting. Inspections themselves are done back in the Quality module.
Motor Line
Motor Line
The Motor Line module runs the Danfoss hydraulic-motor coating work at Seminole. It tracks a motor from the dock to the truck: you print pack labels, receive boxes of motors, pack and QC them at the shop-floor kiosk, then load them onto a truck and record the shipment. Planners flag rush jobs as Hot Orders, dashboards and floor TVs keep everyone pointed at the right work, and a customer portal lets Danfoss look up anything we've shipped.
Everything lives under the Motor Line tab in the top navigation. Dashboard and Reports sit on their own; the rest group into three dropdowns — Orders ▾ (Hot Orders, Finished Orders, In-House Orders), Fulfillment ▾ (Receiving, Load Truck, Shipments, Print Pack Labels, Packing Kiosk ↗), and Admin ▾ (Clear Stale Orders, e-ink Devices, Admin). Paths below are written as Motor Line → Fulfillment ▾ → Receiving: click the module, open the dropdown, pick the screen. This chapter follows a box of motors through the line, then covers the screens managers and admins use.
Permissions: Motor Line is scoped to Seminole. Most pages need the motor_line module; the Reports/Investigate page is also open to quality users through a separate grant. The kiosk and floor TV are public displays authenticated by a device token, not a login. Everything under Admin (plus Clear Stale Orders and e-ink Devices) is admin-only.
Motor Line Dashboard
The dashboard is the internal scoreboard for the line — the production team and management view. It replaces the old public Metabase dashboard.
Go to Motor Line → Dashboard for live tiles including:
- Motors In House and Orders In House — received but not yet packed out
- Oldest In-House and Avg Days In-House — how long work is sitting
- Completed Today — motors packed out today
- QC Overrides Today — supervisor overrides logged at the kiosk
It refreshes every 30 seconds. Numbers are click-through where it helps — a tile drills into the underlying orders or inspections.
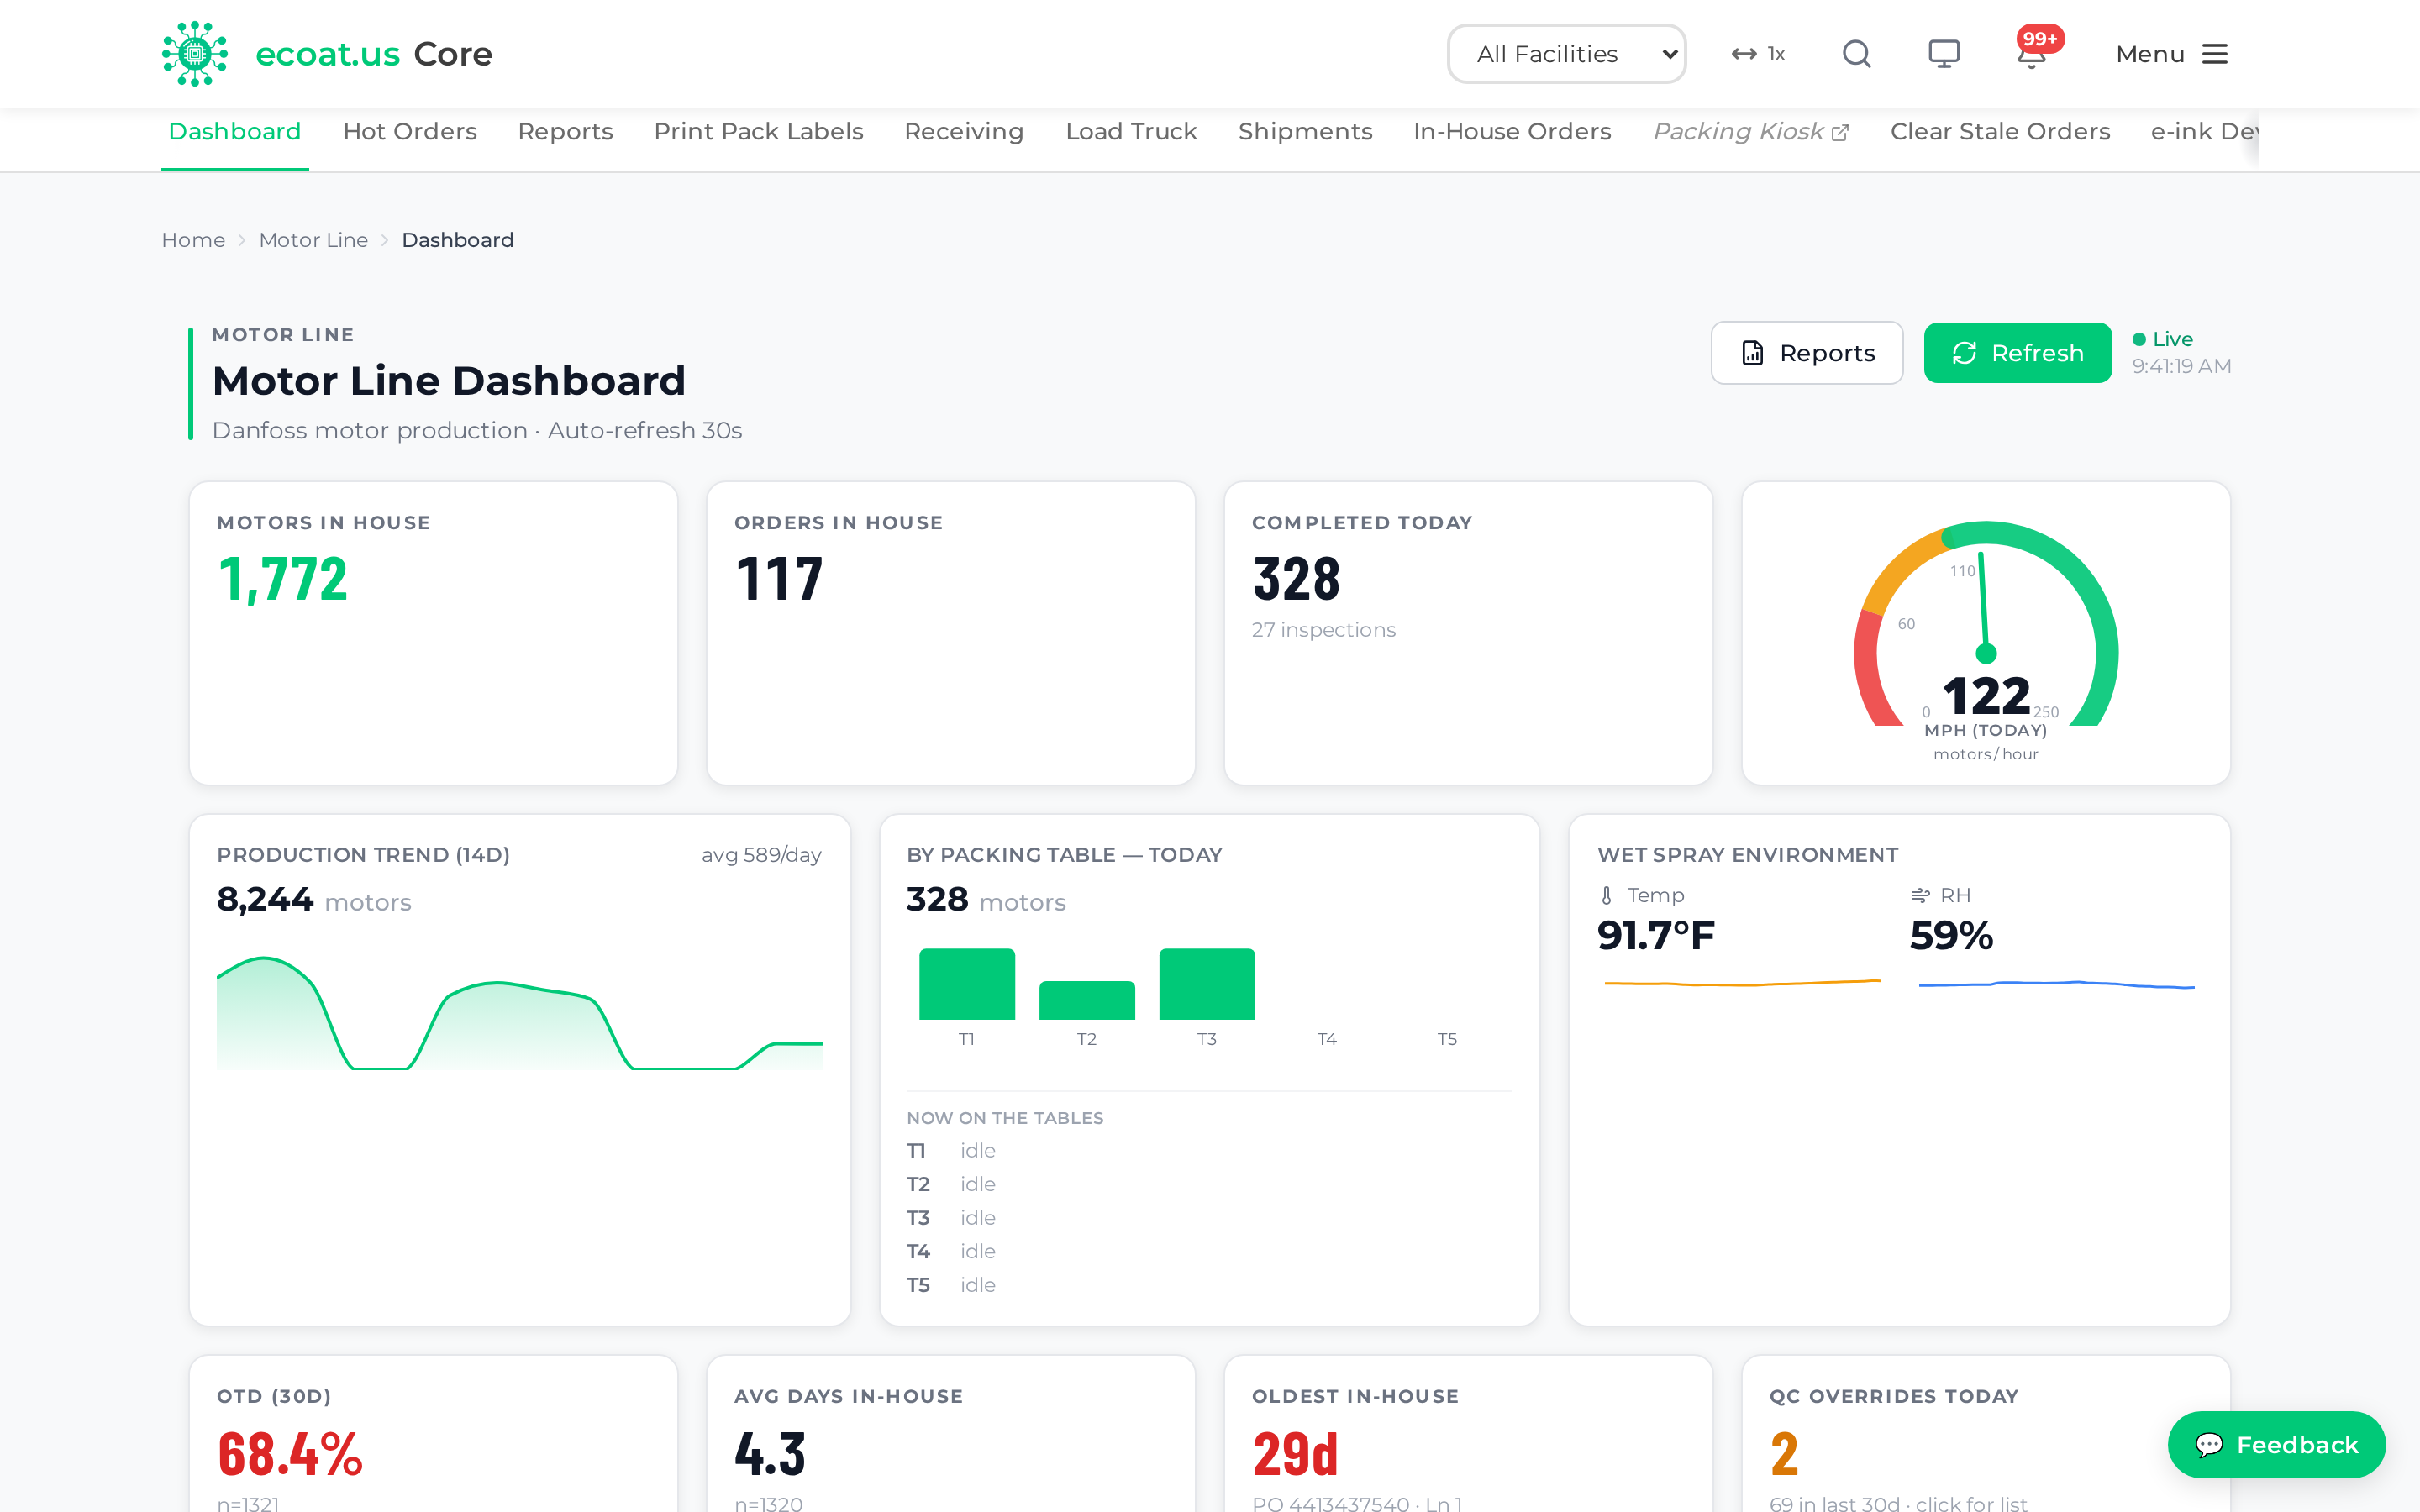
Hot Orders
Hot Orders are the rush jobs — orders a planner has flagged as expedited (and usually upcharged). Flagging an order makes it shout across the whole line.
Flag an order as hot
- Go to Motor Line → Orders ▾ → Hot Orders.
- Click Add Hot Order.
- Enter the PO number, Part #, and set a Priority (Standard or Critical).
- Save.
A hot order then:
- shows on the Floor TV and the e-ink Hot List devices at the tables,
- fires a takeover alert at the packing kiosk when that order is scanned, and
- auto-completes (drops off the board) once the order finishes packing.
Completed and cancelled hot orders stay retrievable as the upcharge record — sort by Completed to find them.
Tip: Use Critical sparingly. If everything is critical, nothing is — the point is to tell the floor which one job jumps the queue.
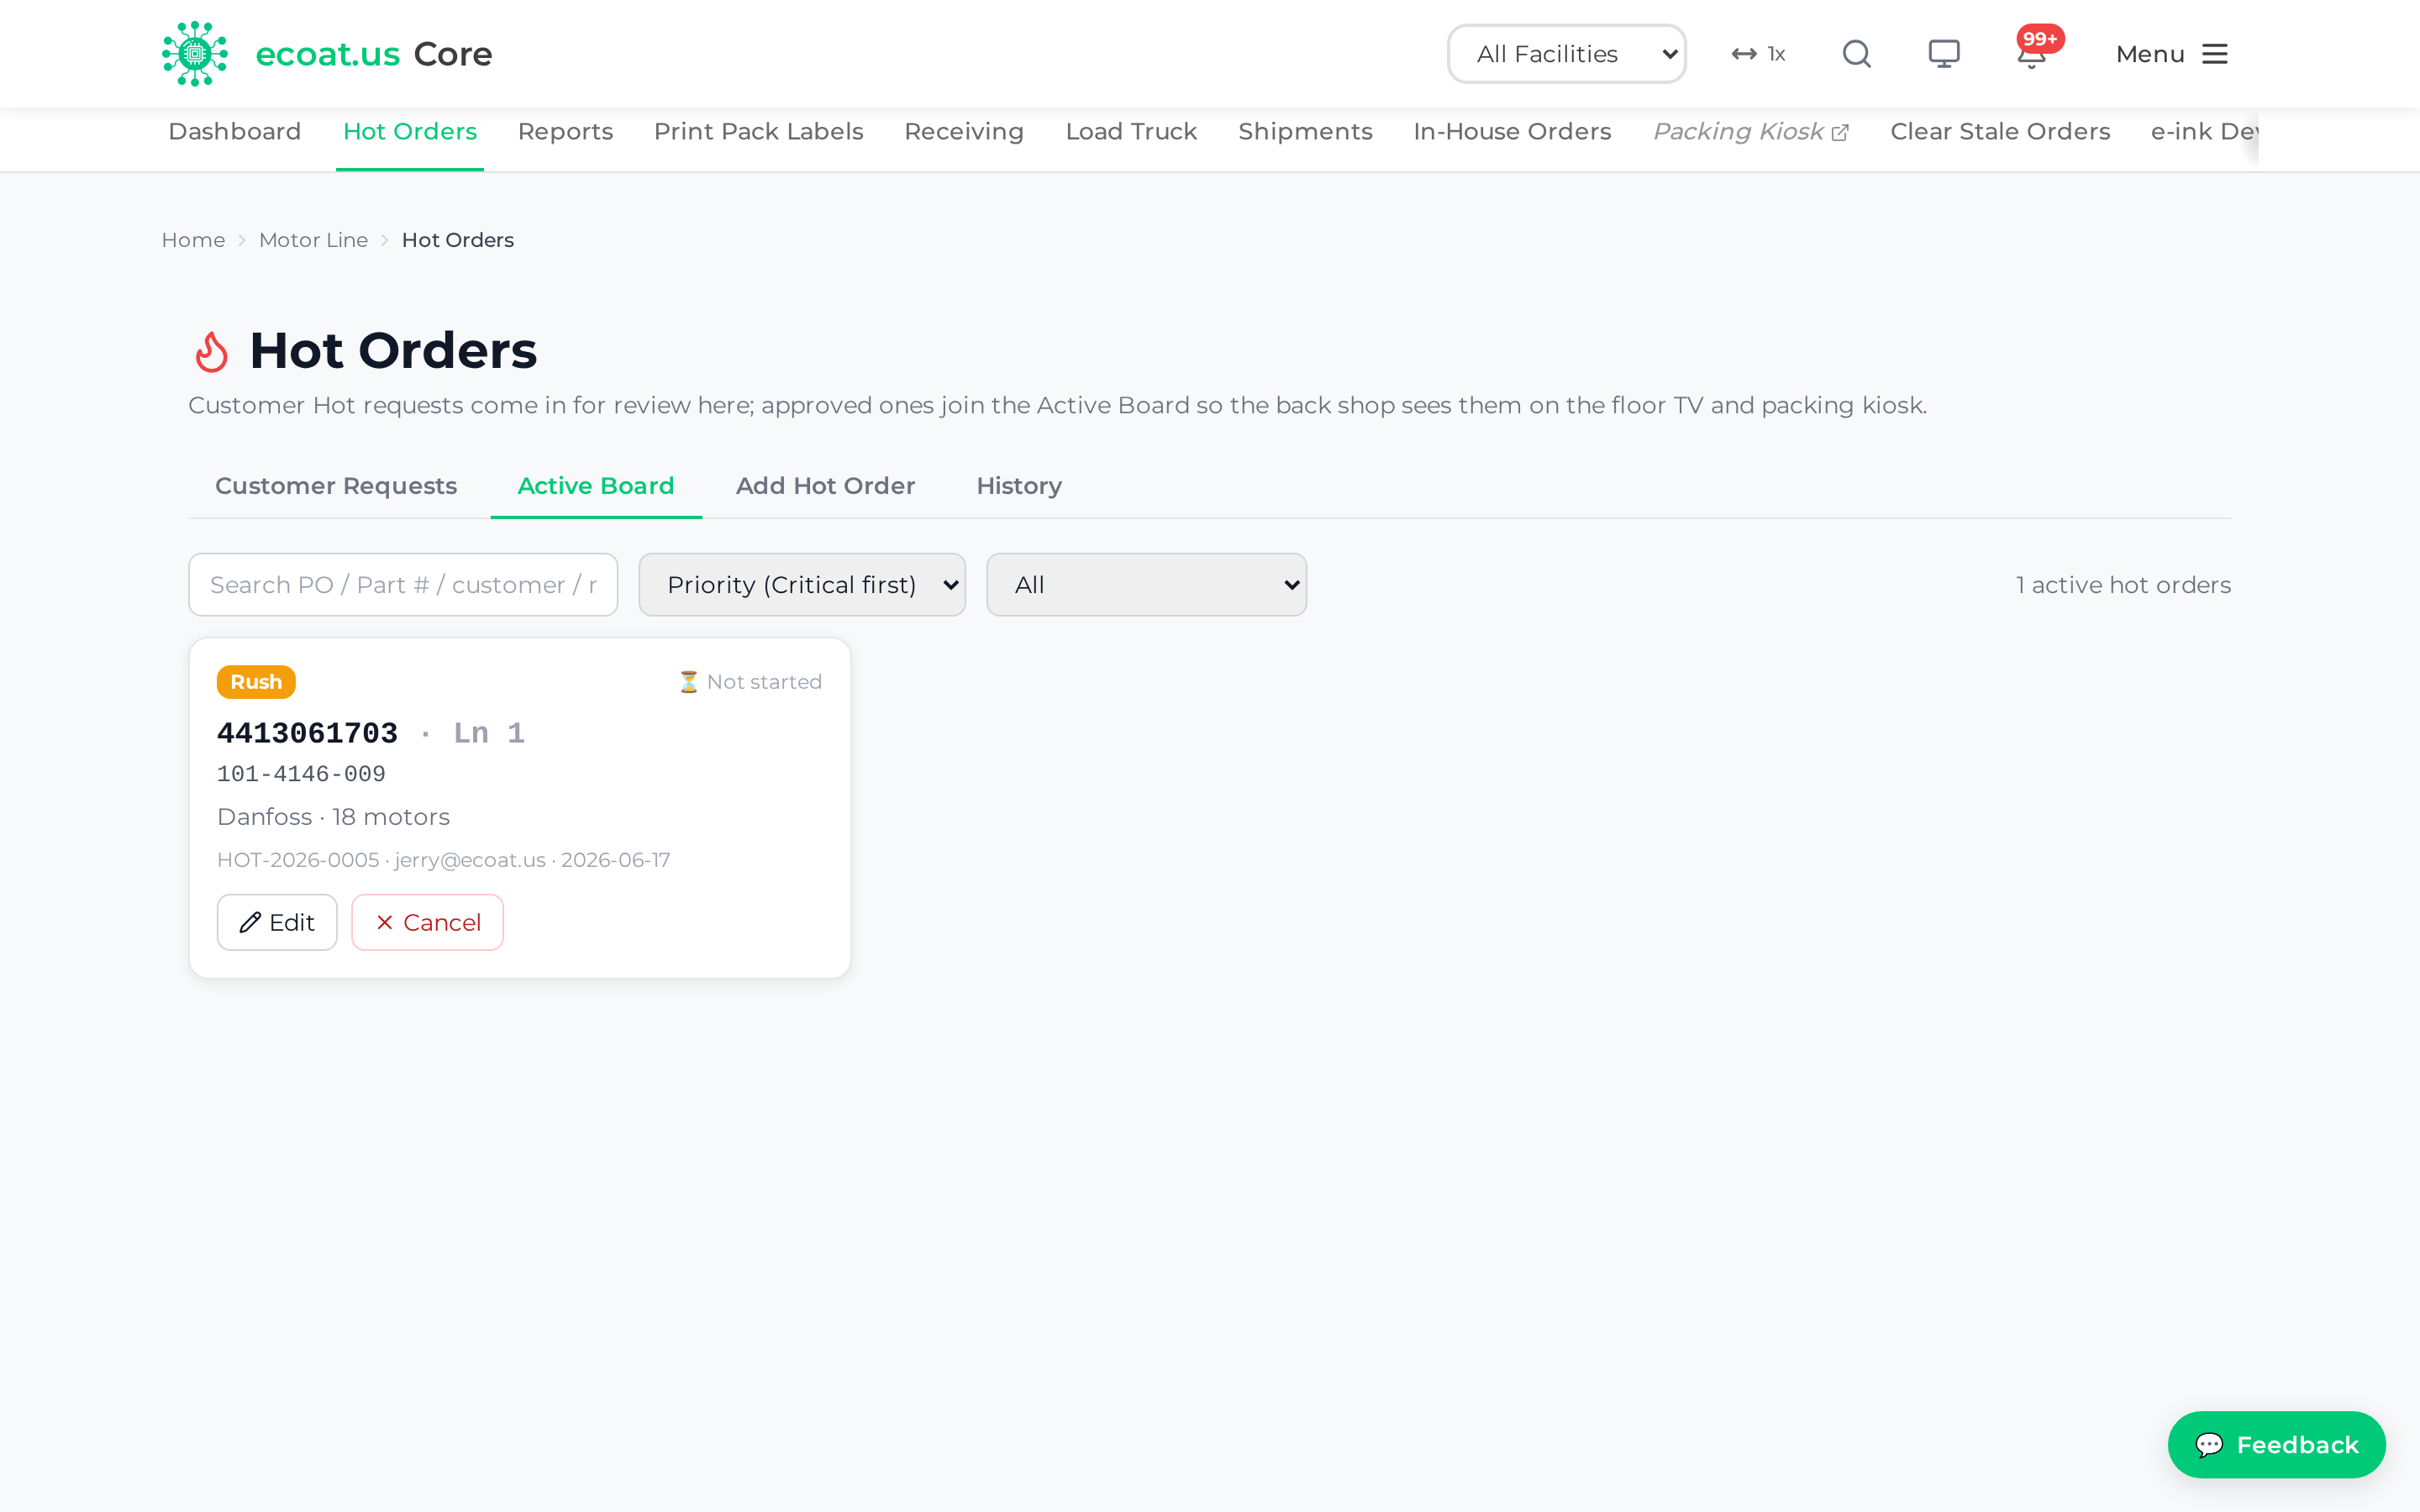
Reports / Investigate
Reports is where you search scans and pull motor-line trends. The old standalone Investigate page was folded in here as the Motors tab, so scan-search links still land in the right place.
- Go to Motor Line → Reports.
- Use the Motors tab to look up scans by PO, part number, serial, or date.
- Use the reporting tabs for throughput and QC trends.
Permissions: This page is available to Motor Line users and to quality users who have the investigate grant, even without full Motor Line access.
Print Pack Labels
Pack labels are the QR labels on each box — one QR per box, carrying the Pack UUID, PO, Line, Box, and Qty so Receiving and Packing can scan instead of type. They print on Avery 5160 sheets (30 labels a sheet).
The fastest path — upload the Danfoss PO PDF
- Go to Motor Line → Fulfillment ▾ → Print Pack Labels.
- Click Upload Danfoss PO and pick the PDF Danfoss emailed (e.g.
4413179217.pdf). - Review the parsed lines in the preview, then click Apply to matrix. The PO number and one row per line item (with the right quantity) fill in for you.
- Set Boxes per line — the PO doesn't say how to split a line into boxes. It defaults to one box of the full quantity; use Duplicate to split a row, or Quick Set to apply the same boxes/qty across many rows.
- Click Generate PDF and print on Avery 5160 at 100% scale (no fit-to-page).
Enter it manually instead
Add one row per PO line with PO, Line #, Boxes, and Qty per box. Use Duplicate to copy a row and Quick Set to fill across rows.
Tip: Reusing a part-used Avery sheet? Set Start Offset to the number of already-peeled cells (counting from the top-left) so printing resumes on the first blank label. The page also remembers your last 5 print jobs — click one to reload those rows.
If the upload fails: "Could not find a Purchase order number" means it isn't a Danfoss PO or it's a scanned image (only text PDFs read); re-export from the email as PDF if you get "Expected a PDF."
Receiving
Receiving logs each box of motors as it hits the dock. Scanning the pack QR fills in the box's identity so you only add what the QR can't carry.
- Open Motor Line → Fulfillment ▾ → Receiving on an iPad or a PC with a scanner.
- Tap Scan Pack QR — a green chip confirms PO, Line, and Qty are pre-filled.
- Scan or type the Work Order (focus jumps here automatically).
- Scan or type the Part Number.
- Confirm the Paint Spec — it's a dropdown of every spec on record, and it auto-fills from the part number's history when there's a strong match. An amber note ("verify before submitting") warns when that part sometimes uses a different spec.
- Tap Submit — the box is added to Inbound and ready for packing.
After a successful submit, click Receive next box on same PO to keep PO, vendor, and paint spec on the form for the next box on the same pallet.
Tip: The form autosaves your draft to that device — walk away and your entry is still there when you come back.
If you see "This pack label has already been received as Inbound #N," the QR was scanned before. Don't re-scan; check Inbound #N with QA.
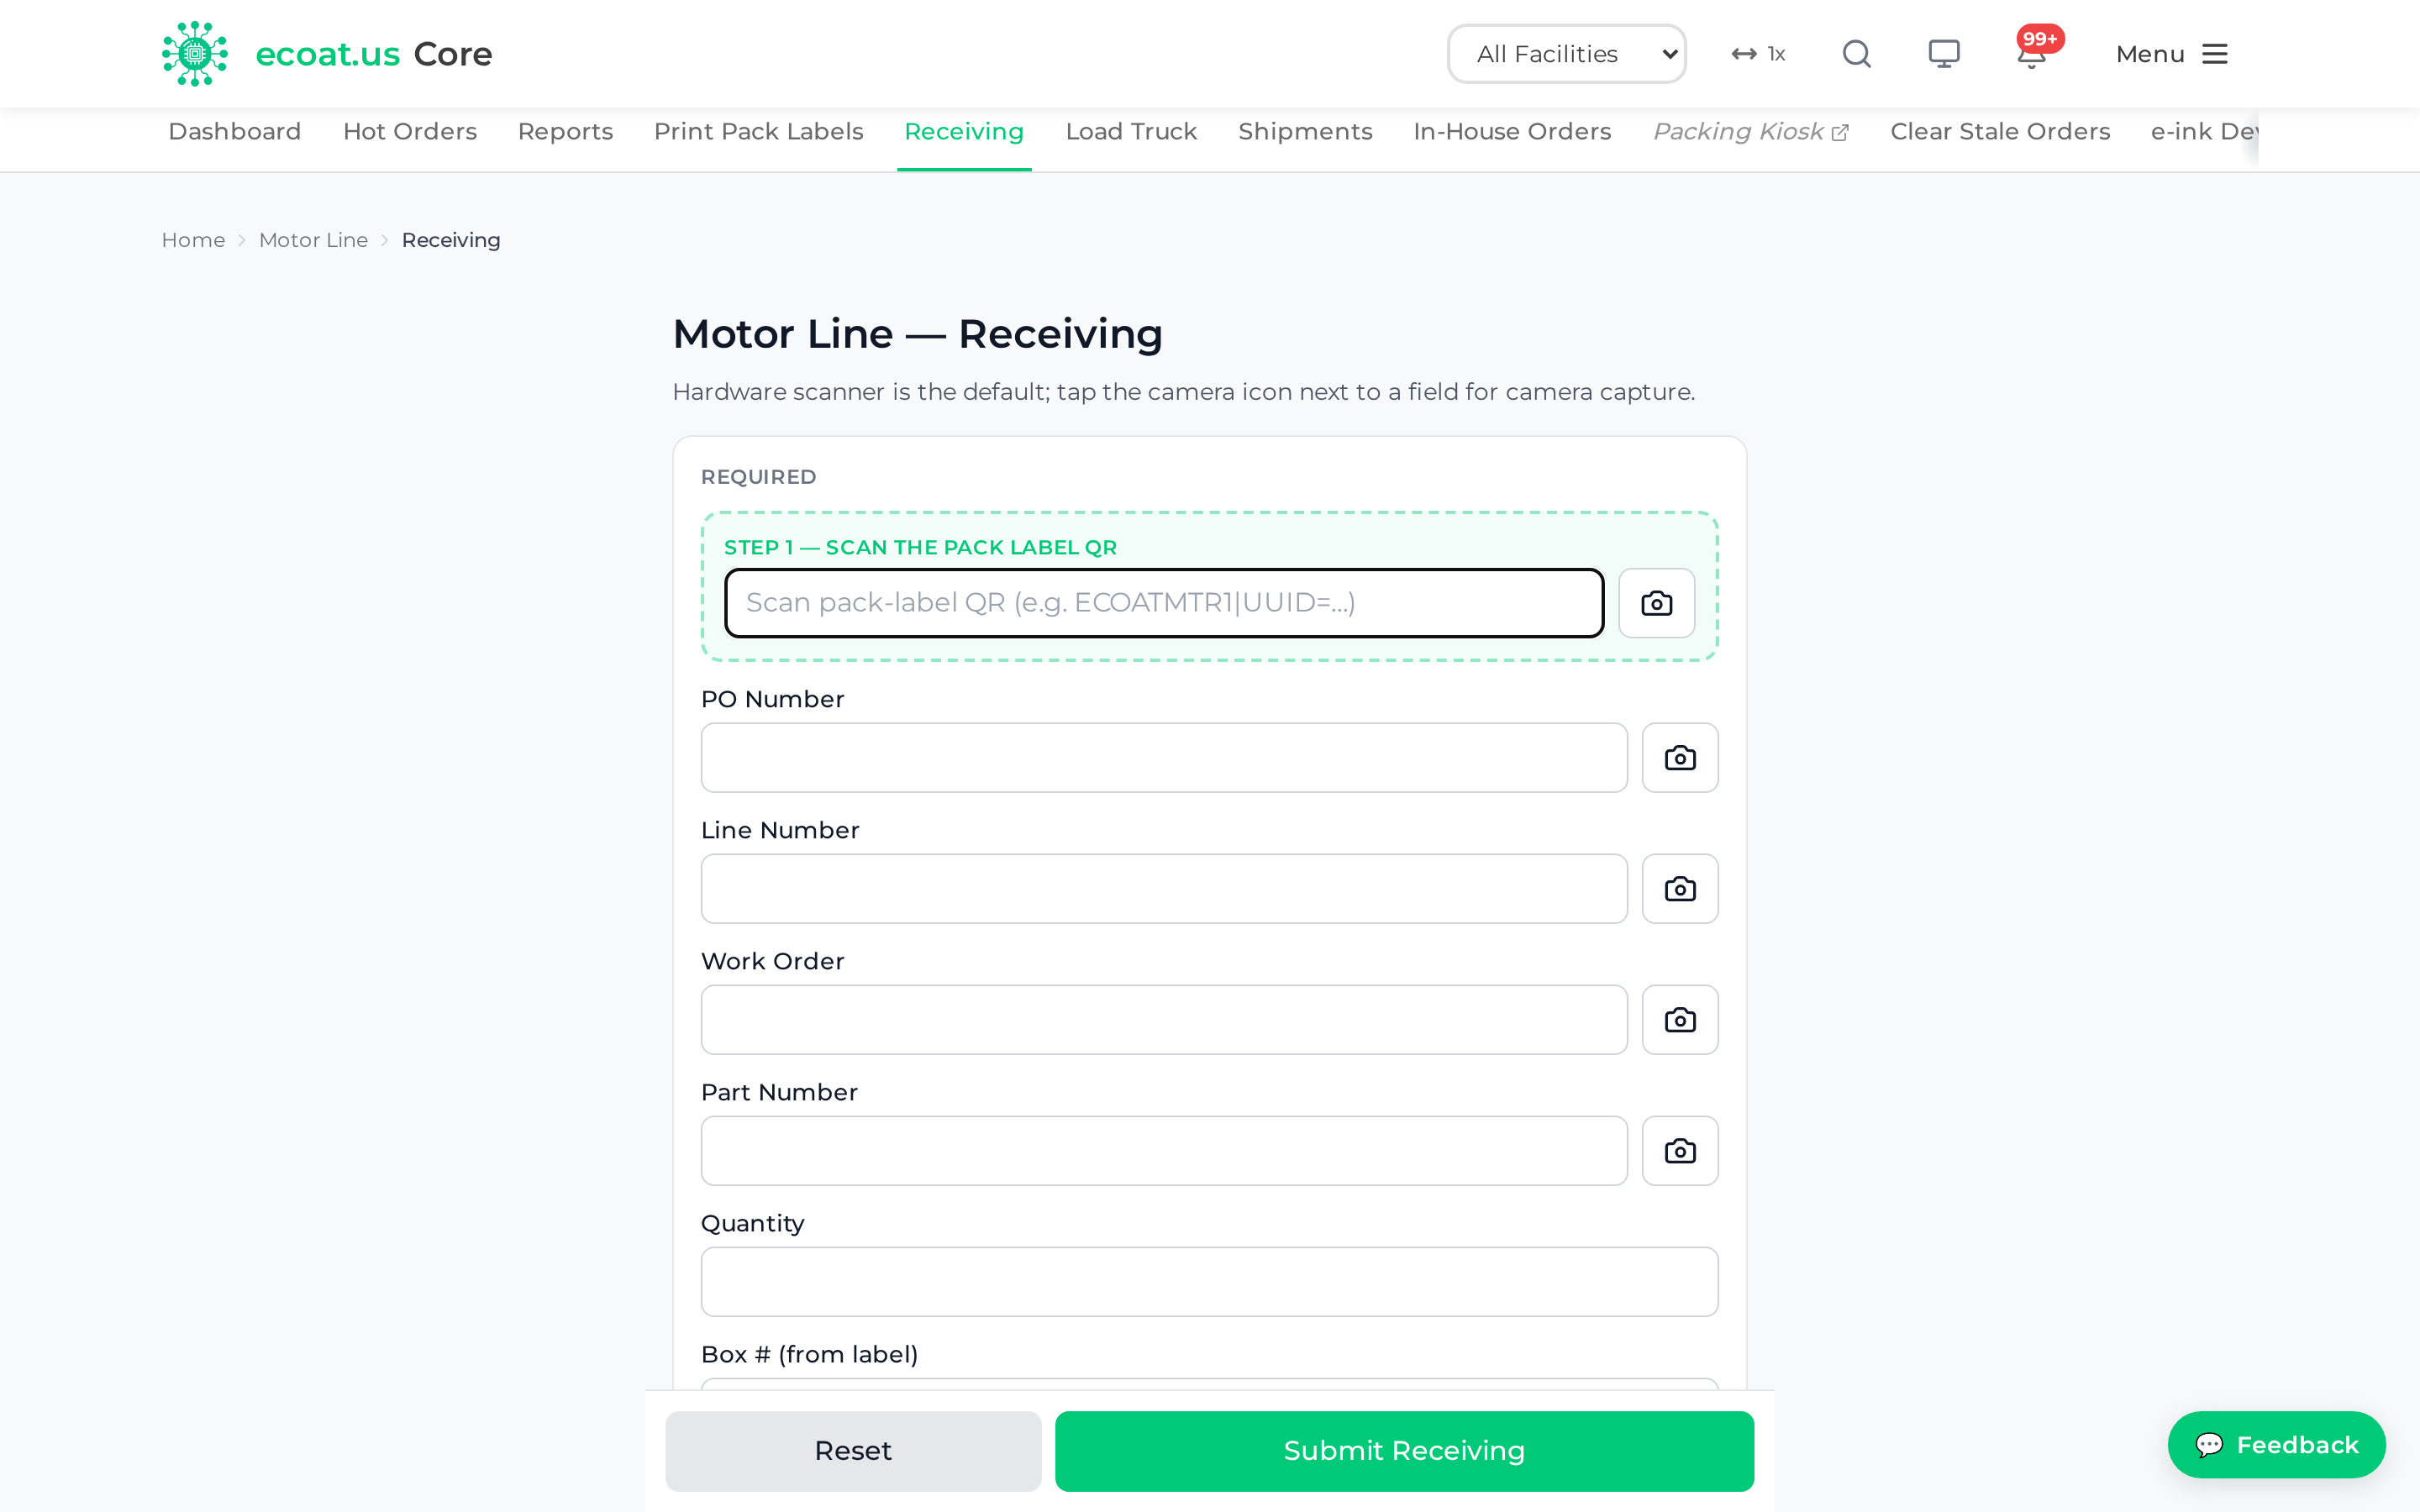
The Packing Kiosk
The Packing Kiosk is a separate full-screen page that runs on the tables in the pack area (portrait TVs with barcode scanners). It has no login and no navigation chrome — it's built for one job: scanning every motor against its box and recording QC. Operators reach it at core.ecoat.us/motor-line/packing; from inside Core it is Motor Line → Fulfillment ▾ → Packing Kiosk, which opens in a new tab (the ↗ next to the label).
Note: If the kiosk ever shows a red "Kiosk Not Enrolled" alarm instead of the packing screen, the device has lost its enrollment token — send it to IT to re-enroll. It will not let you pack until it's fixed.
Operator flow
- Pick your table. Confirm the Table 1–5 badge in the top-right. If the picker shows instead, tap your table number (or press 1–5 on the keyboard). Tap Change Table in the header if you moved kiosks.
- Scan the pack label. Tap Scan Pack Label and point the scanner at the box's QR. The kiosk loads that box's PO, line, part number, and quantity.
- Pack the motors. The kiosk picks the mode from the inspection record and shows it at the top: - Bulk — scan the box label once; the packed count jumps by the box quantity. Used when a box holds several motors of the same part. - Individual — scan each motor label, then the box. Used when traceability matters (active CAPA parts, customer requirement, first article).
- Watch and listen for the result. A short high beep + green flash means the scan was accepted; a low double-beep + red flash means it was rejected (wrong part, wrong table, or a duplicate).
- Record QC readings when prompted — Film Build (mils), Pencil Hardness, and Meets Customer Requirements — for the inspection record.
- Finish the session. When the packed count reaches the quantity, a Final QC strip appears at the bottom. Walk the checklist (visual, packing slip, pallet count), tap each green check, then tap Complete Session to save the inspection.
To stop early, tap Cancel and confirm — the session is marked Abandoned, no finished-goods record is written, but the scans are kept for traceability.
Part-number mismatch and supervisor override
If a scanned motor's part number doesn't match the box, the kiosk hard-blocks and opens the Supervisor Override panel:
- A QC supervisor enters their 5-digit PIN.
- Press Enter to approve, or Esc / tap outside to cancel.
- The override is logged (supervisor, time, motor, box).
- Three wrong PINs in a row locks the kiosk for 60 seconds.
Permissions: PINs belong to QC supervisors only. Operators must never share or guess them. If a motor genuinely doesn't belong in the box, tap Record Non-Con Motor and pick the reason rather than forcing it through.
Load Truck
Load Truck is the dock app for loading a finished shipment. A dock worker scans each packed box's pack-ticket QR as it goes on the truck, then the driver signs.
- Open Motor Line → Fulfillment ▾ → Load Truck on an enrolled dock tablet (or signed in as a supervisor).
- Open the shipment you're loading.
- Scan each box's pack ticket as it's loaded. Progress is saved server-side per scan, so a mid-load refresh loses nothing.
- When the truck is loaded, have the driver sign to record the shipment.
Shipments
Shipments is the management record of every truck that left.
- Go to Motor Line → Fulfillment ▾ → Shipments.
- Browse the list of truck loads; click one to drill into its contents, the driver, and the signature.
- A supervisor can Void a shipment if it was recorded in error.
It's read-only otherwise — full traceability for operations.
Finished Orders
Finished Orders is the results-first view of orders that have already been packed out — built for the quality team to see, at a glance, which ones came back NON-CON. Go to Motor Line → Orders ▾ → Finished Orders.
- Filter by result (all / non-con / pass) and by date, then search by PO, part number, or work order.
- Each row carries a result badge with the expected-vs-scanned quantity, and flags a quantity mismatch.
- Click a row to open why an order was rejected — the order-level nonconforming condition, the per-motor failed list with reasons, any QC overrides, and double-scan flags.
Tip: The list filters and searches a recent window of orders. For deep history, use Reports → Orders and export CSV instead.
Permissions: Open to the same users as Reports/Investigate (Motor Line plus quality users with the investigate grant) and to motor-line supervisors, who own the line and need to see rejection outcomes.
In-House Orders
In-House Orders are motors that have been received but not yet packed out. It's the working list behind the "Motors In House" dashboard number.
- Go to Motor Line → Orders ▾ → In-House Orders.
- Search and filter by part, paint spec, or how many days a box has been sitting.
- Motor-line supervisors (and admins) can edit an order's identity fields — those changes sync back to the receiving record so the kiosk and dashboards stay consistent — or Remove an order from the in-house list.
Everyone with Motor Line access can view and search; only supervisors/admins can change anything, and every change is audited.
Floor TV
The Floor TV is the wall display in the production area — it shows the day's production numbers and the hot-order list to the whole floor. A Linux box auto-opens it full-screen with the display token in the address; there's no login.
The current address is:
core.ecoat.us/motor-line/floor-tv?token=<display token>
The old address, core.ecoat.us/motor-line/floor, still works — it now redirects to /motor-line/floor-tv and carries your ?token= (or ?key=) across, so a TV that was already pointed at the old URL switches over on its next refresh with nothing to change.
What the TV shows is now a picture slideshow, not a web page: the server renders each board as a full 4K PNG and the page simply crossfades between two slides — production and hot list — every 6 seconds. Each image is re-fetched on its turn and the server holds its render for about 20 seconds, so the numbers on screen are roughly 20 seconds old. This is deliberate: smart-TV browsers couldn't reflow or scroll the old React page and kept cutting the bottom off. If the TV loses the server it shows a small "offline — retrying" note in the corner and keeps trying.
There's also a public dashboard variant (/motor-line/public-dashboard) for a lobby or open-floor kiosk.
e-ink Device Labels (Hot List)
The e-ink devices are small battery screens at the tables (Xteink X4) that show the current Hot List — the hot orders the floor needs to jump on. They update over the air from the same hot-order data, so what a planner flags in Hot Orders shows up on the tables without anyone printing anything.
Admins check the fleet's health at Motor Line → Admin ▾ → e-ink Devices: station, battery level, last check-in, and firmware. The page is read-only — provisioning and token minting are done through the device-setup flow, not here.
Admin corner
These pages are admin-only. Clear Stale Orders, e-ink Devices, and Admin each have their own entry under Motor Line → Admin ▾; the rest are tiles on the Admin page (Motor Line → Admin ▾ → Admin). Most people never need them — they're for fixing data, managing supervisors, and auditing what happened.
| Page | What it's for |
|---|---|
| Clear Stale Orders | Review and clear orders that were received but never packed, so they stop inflating the "motors in house" count. Every clear is audited. |
| e-ink Devices | Fleet health of the Hot List e-ink screens (battery, check-in, firmware). |
| Customer PN Map | Maintain the map between customer part numbers and our internal part numbers. |
| PN Exceptions | Custom notes on specific part numbers that show on the Receiving form. |
| Supervisors | The QC supervisor roster and their kiosk PINs (create, reset PIN, deactivate — PINs are stored hashed and never shown). |
| Inbound | Edit or hard-delete receiving records to undo a data-entry mistake. |
| Inspections | Edit inspection metadata and Reopen a completed inspection. |
| Scans | Edit or hard-delete individual motor scans. |
| Overrides | Read-only viewer of QC overrides — filter by supervisor, status, or date and open the override data. |
| Audit | Read-only audit log of every change — filter by table, user, action, or date, with a side-by-side old/new diff. |
Permissions: Every page here requires admin. Edits and deletes are audited, and the Audit page is where you go to see who changed what.
Maintenance
Maintenance
The Maintenance module keeps your equipment running. It's where you track every machine, log and assign repair jobs, schedule the routine servicing that prevents breakdowns, and let shop-floor workers report problems the moment they spot them.
Everything lives under the Maintenance tab in the top navigation. This chapter walks through each part in the order you'll usually use it.
Maintenance Dashboard
The dashboard is your at-a-glance health check for equipment across your facility. It's the first thing you see when you open the Maintenance tab.
What you'll see
Four headline numbers sit at the top:
| KPI | What it means | Healthy target |
|---|---|---|
| Equipment Health Score | Overall condition rating, 0–100 | Above 80% |
| PM Compliance Rate | Percent of scheduled servicing done on time | Above 90% |
| Open Work Orders | Repair jobs still in the queue | Keep an eye on it |
| Overdue Tasks | Preventive tasks past their due date | 0 |
Below the KPIs, an Equipment Condition breakdown shows progress bars by condition — Good (green), Fair (yellow), Poor (orange), and Critical (red). Click the Poor or Critical count to jump straight to the equipment that needs attention.
The Work Order Analytics section groups your jobs by type, status, and priority, and charts how many were created each day.
Two reliability numbers help you tune your maintenance schedule:
- MTTR (Mean Time To Repair) — average hours to close a work order. Lower is better.
- MTBF (Mean Time Between Failures) — average days a machine runs between breakdowns. Higher is better.
Tip: If a machine's MTBF is shorter than how often you service it, you're servicing it too rarely. Tighten the PM frequency.
How to change the reporting period
- Use the period selector to choose Last 7 days, 30 days, 60 days, or 90 days.
- The analytics and trend charts refresh to match.
Use 7 or 30 days for day-to-day operations and 60 or 90 days when you're looking for longer trends.
Equipment
Equipment is your master registry of every machine, tool, and asset you maintain. This is where each item gets a permanent record, a criticality rating, and a running service history.
Find a piece of equipment
- Go to Maintenance > Equipment.
- Filter by category, criticality (A/B/C), condition, or active status.
- Or search by name, Asset ID, or serial number.
Add a new piece of equipment
- Click + Add Equipment.
- Fill in the required fields: - Name — a clear, descriptive name - Asset ID — the unique tag (see format below) - Facility — where it lives - Category — the equipment type - Criticality — its ABC rating
- Add any optional details you have: manufacturer, model, serial number, install date.
- Click Create Equipment.
ABC criticality — how important is this machine?
| Level | Name | Meaning |
|---|---|---|
| A | Critical | Stops production or affects safety |
| B | Important | Significant impact, but a backup exists |
| C | Low | Minimal impact, easily replaced |
Tip: Put your preventive-maintenance effort on A-level equipment first — that's where a missed service hurts most.
Asset ID format
Asset IDs follow EQ-{FACILITY}-{NUMBER}:
| Facility | Prefix |
|---|---|
| Seminole | EQ-SEM-NNNN |
| Tulsa | EQ-TUL-NNNN |
| Cleveland | EQ-CLE-NNNN |
| Mission | EQ-MIS-NNNN |
Condition ratings
| Condition | Meaning | What to do |
|---|---|---|
| Good | Running normally | Keep to the schedule |
| Fair | Minor wear, still working | Watch it; consider servicing early |
| Poor | Significant wear | Schedule a repair, service more often |
| Critical | Failing or unsafe | Take it out of service |
Print QR labels for the shop floor
Every piece of equipment can carry a QR label that jumps straight to the reporting kiosk when scanned.
- Open the equipment's detail page (click it in the list).
- Click the purple Print Labels button.
- A PDF downloads with the QR code label.
The label carries the QR code, Asset ID, name, location, category, and a "SCAN FOR SERVICE" prompt.
Tip: Print on Avery 5163 sheets (10 labels per sheet, 2"×4") at 100% scale, and test on plain paper first. Stick the label somewhere visible on the machine.
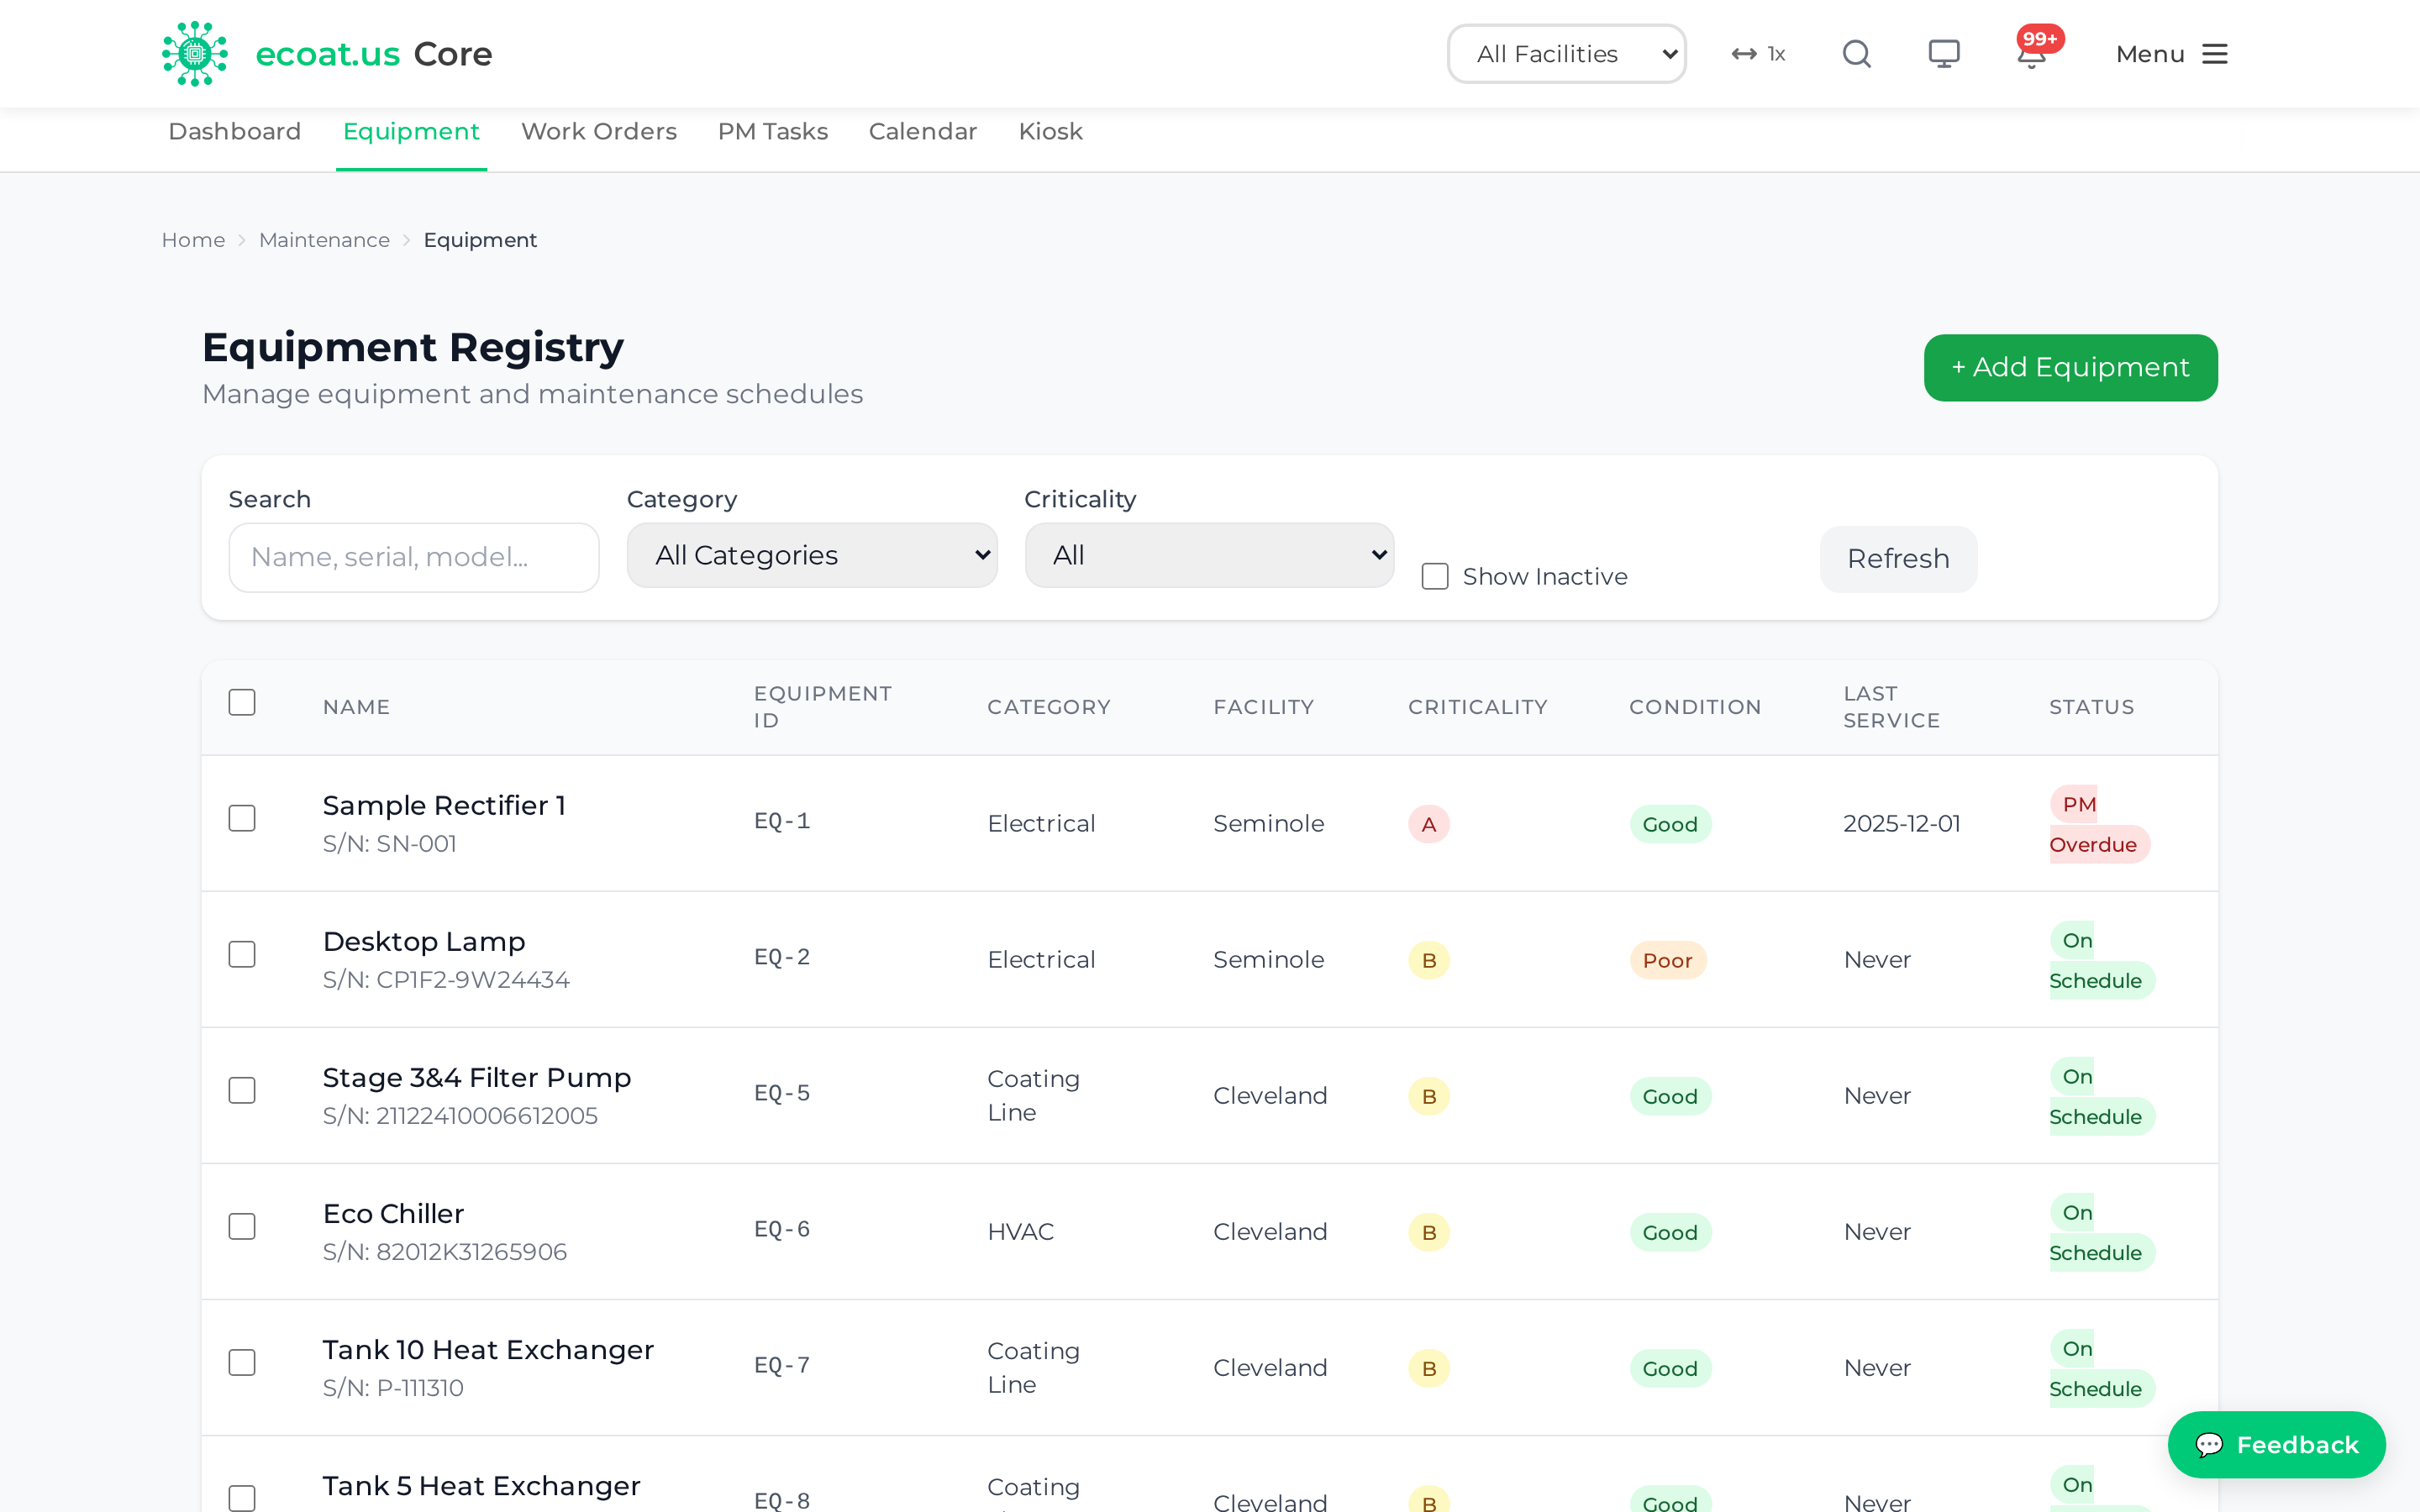
Work Orders
Work orders are the individual repair and service jobs. Each one moves through a simple lifecycle from the moment it's raised to the moment it's finished.
OPEN → ASSIGNED → IN PROGRESS → COMPLETED
              ↓
         (or CANCELLED)
Create a work order
- Click + New Work Order.
- Fill in the required fields: - Title — a brief description of the job - Equipment — pick it from the dropdown - Type — Breakdown, Preventive, Safety, or Other - Priority — Emergency, High, Medium, or Low
- Add a description, an assignee, or a scheduled date if you have them.
- Click Create Work Order.
Set the right priority
| Priority | Response time | Examples |
|---|---|---|
| Emergency | Immediate | Safety hazard, production down |
| High | Within 4 hours | Major equipment issue |
| Medium | Within 24 hours | Non-critical repairs, routine PM |
| Low | Within a week | Minor issues, improvements |
Complete a work order
- Open the work order's detail page.
- Click Complete Work Order.
- Fill in the required fields: - Actual Hours — time spent - Work Performed — what you did
- Optionally add parts used and any follow-up notes.
- Click Complete.
Finishing a work order automatically writes a service record and updates the equipment's history for you.
Kanban view
Click the Kanban (board) toggle for a visual workflow. Jobs appear as cards in columns — Open, Assigned, In Progress, Completed — colour-coded by priority. Drag a card between columns to change its status.
Work order numbers
Numbers follow WO-YYYY-NNNN, for example WO-2026-0001 (the first of 2026) or WO-2026-0150.
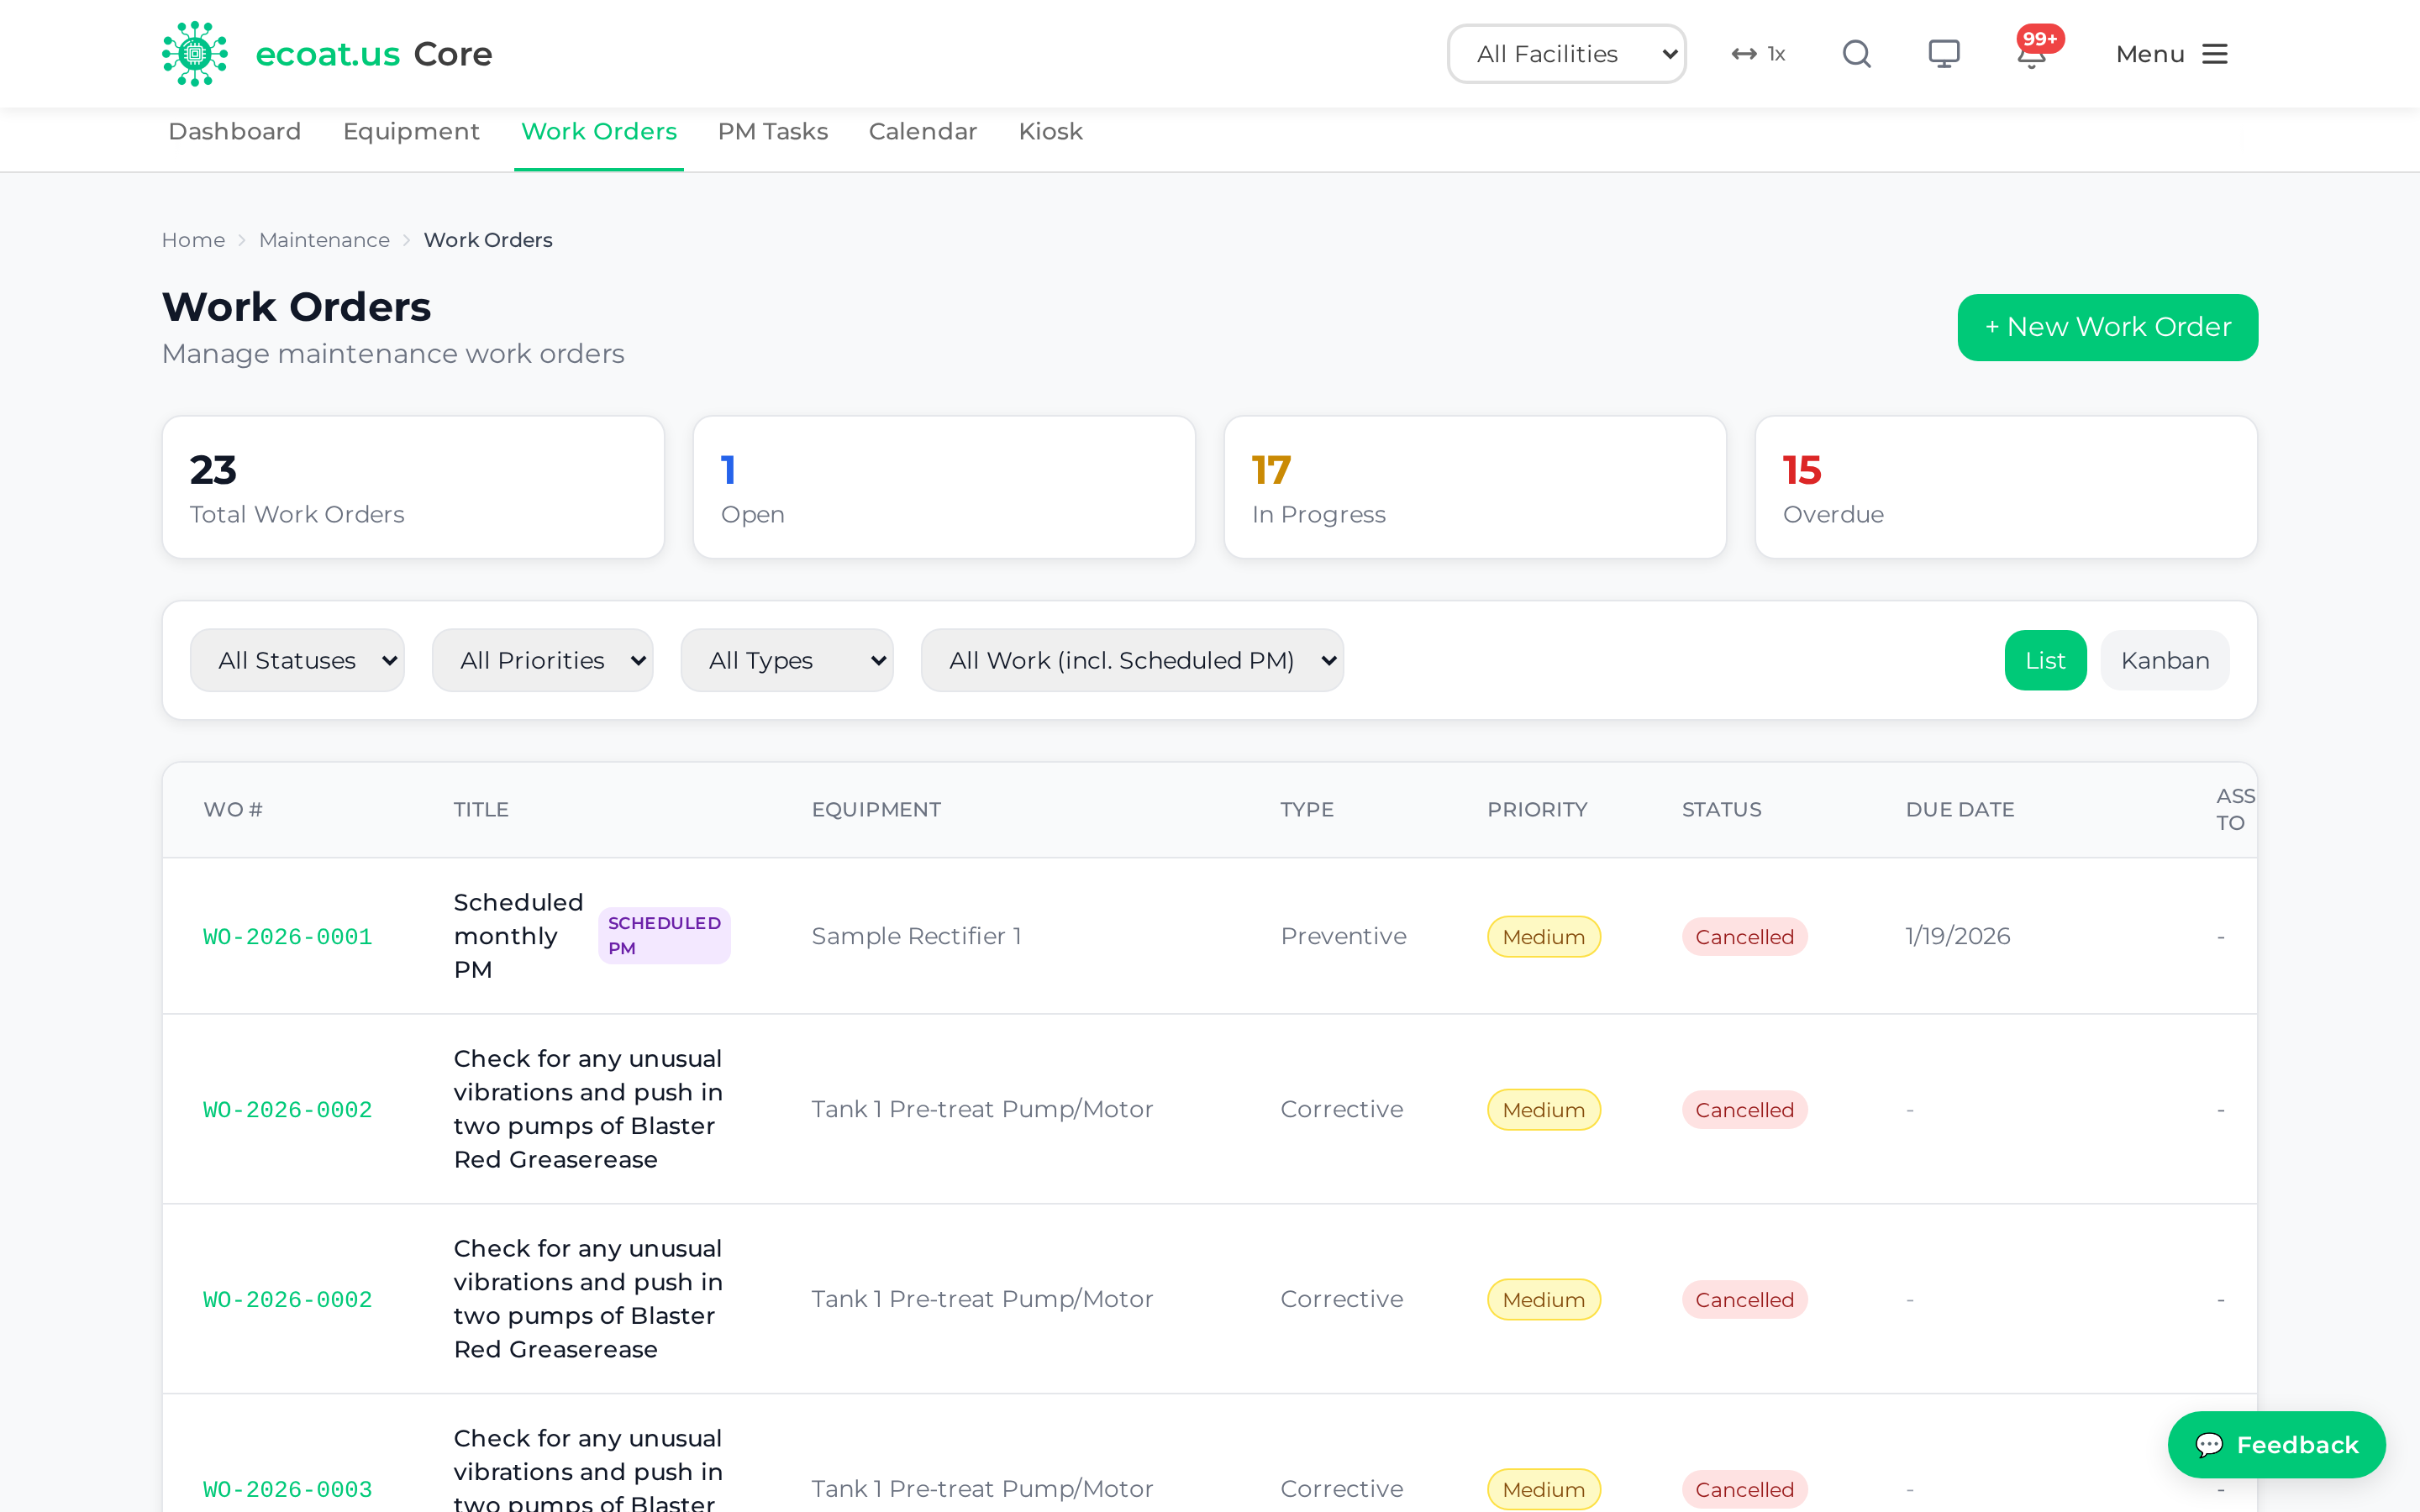
PM Tasks
PM (preventive maintenance) tasks are the recurring servicing schedules that keep machines healthy before they break. Set a task up once, and the system generates the work orders for you on schedule.
Choose a frequency
| Frequency | How often | Example |
|---|---|---|
| Daily | Every day | Safety checks |
| Weekly | Every 7 days | Fluid-level checks |
| Monthly | Every 30 days | Filter inspection |
| Quarterly | Every 90 days | Lubrication |
| Semi-Annual | Every 180 days | Belt replacement |
| Annual | Every 365 days | Full service |
| Runtime-Based | By operating hours | Oil change every 500 hours |
Create a PM task
- Click + New PM Task.
- Fill in the required fields: - Name — what the task covers - Equipment — pick the machine - Frequency — how often it runs - Priority — the priority of the work orders it will create
- Add instructions, safety notes, and an estimated time if useful.
- Click Create Task.
Turn tasks into work orders
- One task: open its detail page and click Generate Work Order.
- In bulk: click Generate PM Work Orders, choose how many days ahead to look (7, 14, or 30), and click Generate. The system creates work orders for every task due in that window.
Tip: Run the bulk generator once a week so your team always has the upcoming preventive jobs queued up.
PM Calendar
The calendar shows what's due and when, laid out month by month.
- Go to Maintenance > Calendar.
- Navigate between months with the arrows.
- Each day shows the PM tasks due and any scheduled work orders, colour-coded by priority.
- Click a day to see its details.
Task colours tell you the schedule at a glance:
| Colour | Meaning |
|---|---|
| Red | Overdue |
| Yellow | Due soon (within 7 days) |
| Green | On schedule |
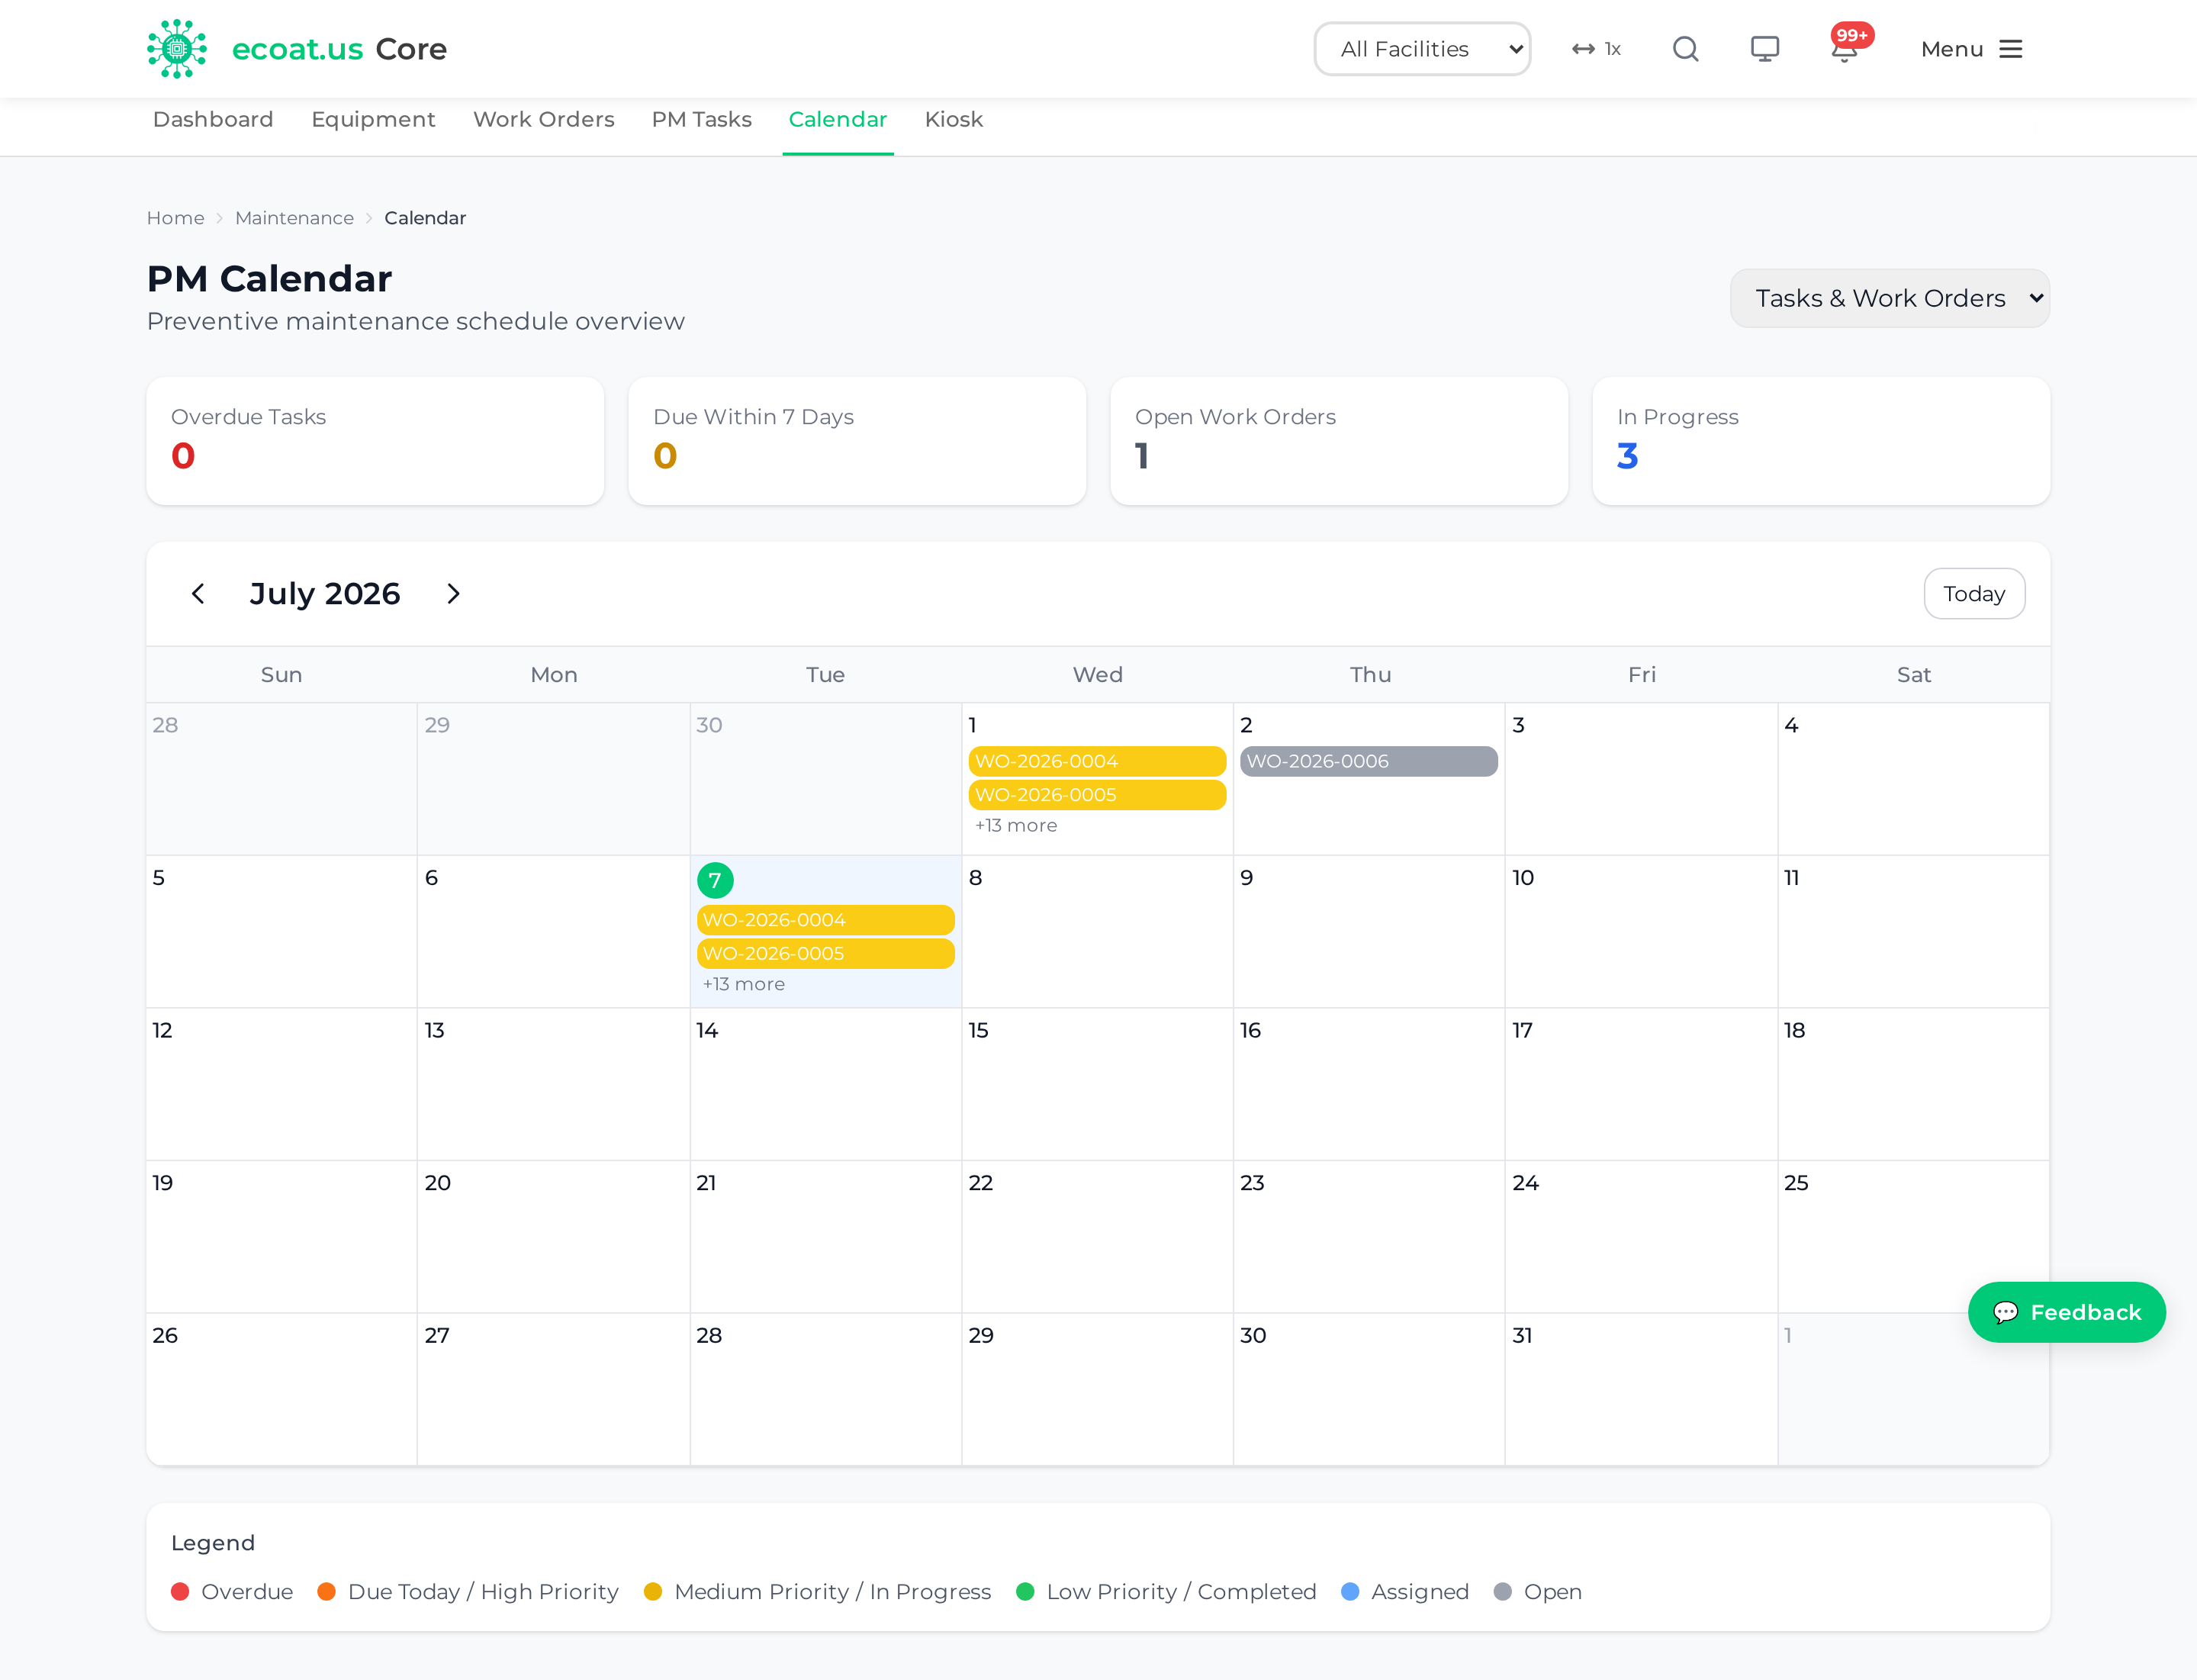
QR Kiosk — reporting issues from the floor
The Maintenance Kiosk is a big-button, touch-friendly screen for shop-floor workers to report an equipment problem in seconds — no login gymnastics, no digging through menus.
Open the kiosk
- From the dashboard: click the Kiosk Mode button (top right).
- By QR code: scan the label on a machine — the kiosk opens with that equipment already selected.
- Direct link:
core.ecoat.us/maintenance/kiosk.
Find the equipment
Scan its QR code: 1. Tap Scan Equipment. 2. Allow camera access. 3. Point at the machine's QR code — its details appear.
Or enter the Asset ID: 1. Tap Enter Asset ID. 2. Type the ID (e.g., EQ-SEM-0001). 3. Tap Search.
Report the issue (3-step wizard)
- Issue type — Breakdown (stopped working), Preventive (service needed), Safety (a hazard), or Other.
- Priority — Emergency (red, production stopped), High (orange, needs attention today), Medium (yellow, within 24 hours), or Low (green, can wait).
- Details (optional) — a short description of the problem and your name.
When you submit, a green checkmark confirms it and shows the new work order number (e.g., WO-2026-0001). The kiosk returns home automatically after 10 seconds, or tap Done to go back right away.
Tip: Hold your device 6–12 inches from the QR code in good light and keep it steady. If a label is damaged, use Enter Asset ID instead.
Permissions: The kiosk is designed for anyone on the floor to use — its whole point is fast, low-friction reporting. Reviewing, assigning, and completing the work orders it creates happens back in the full Maintenance module.
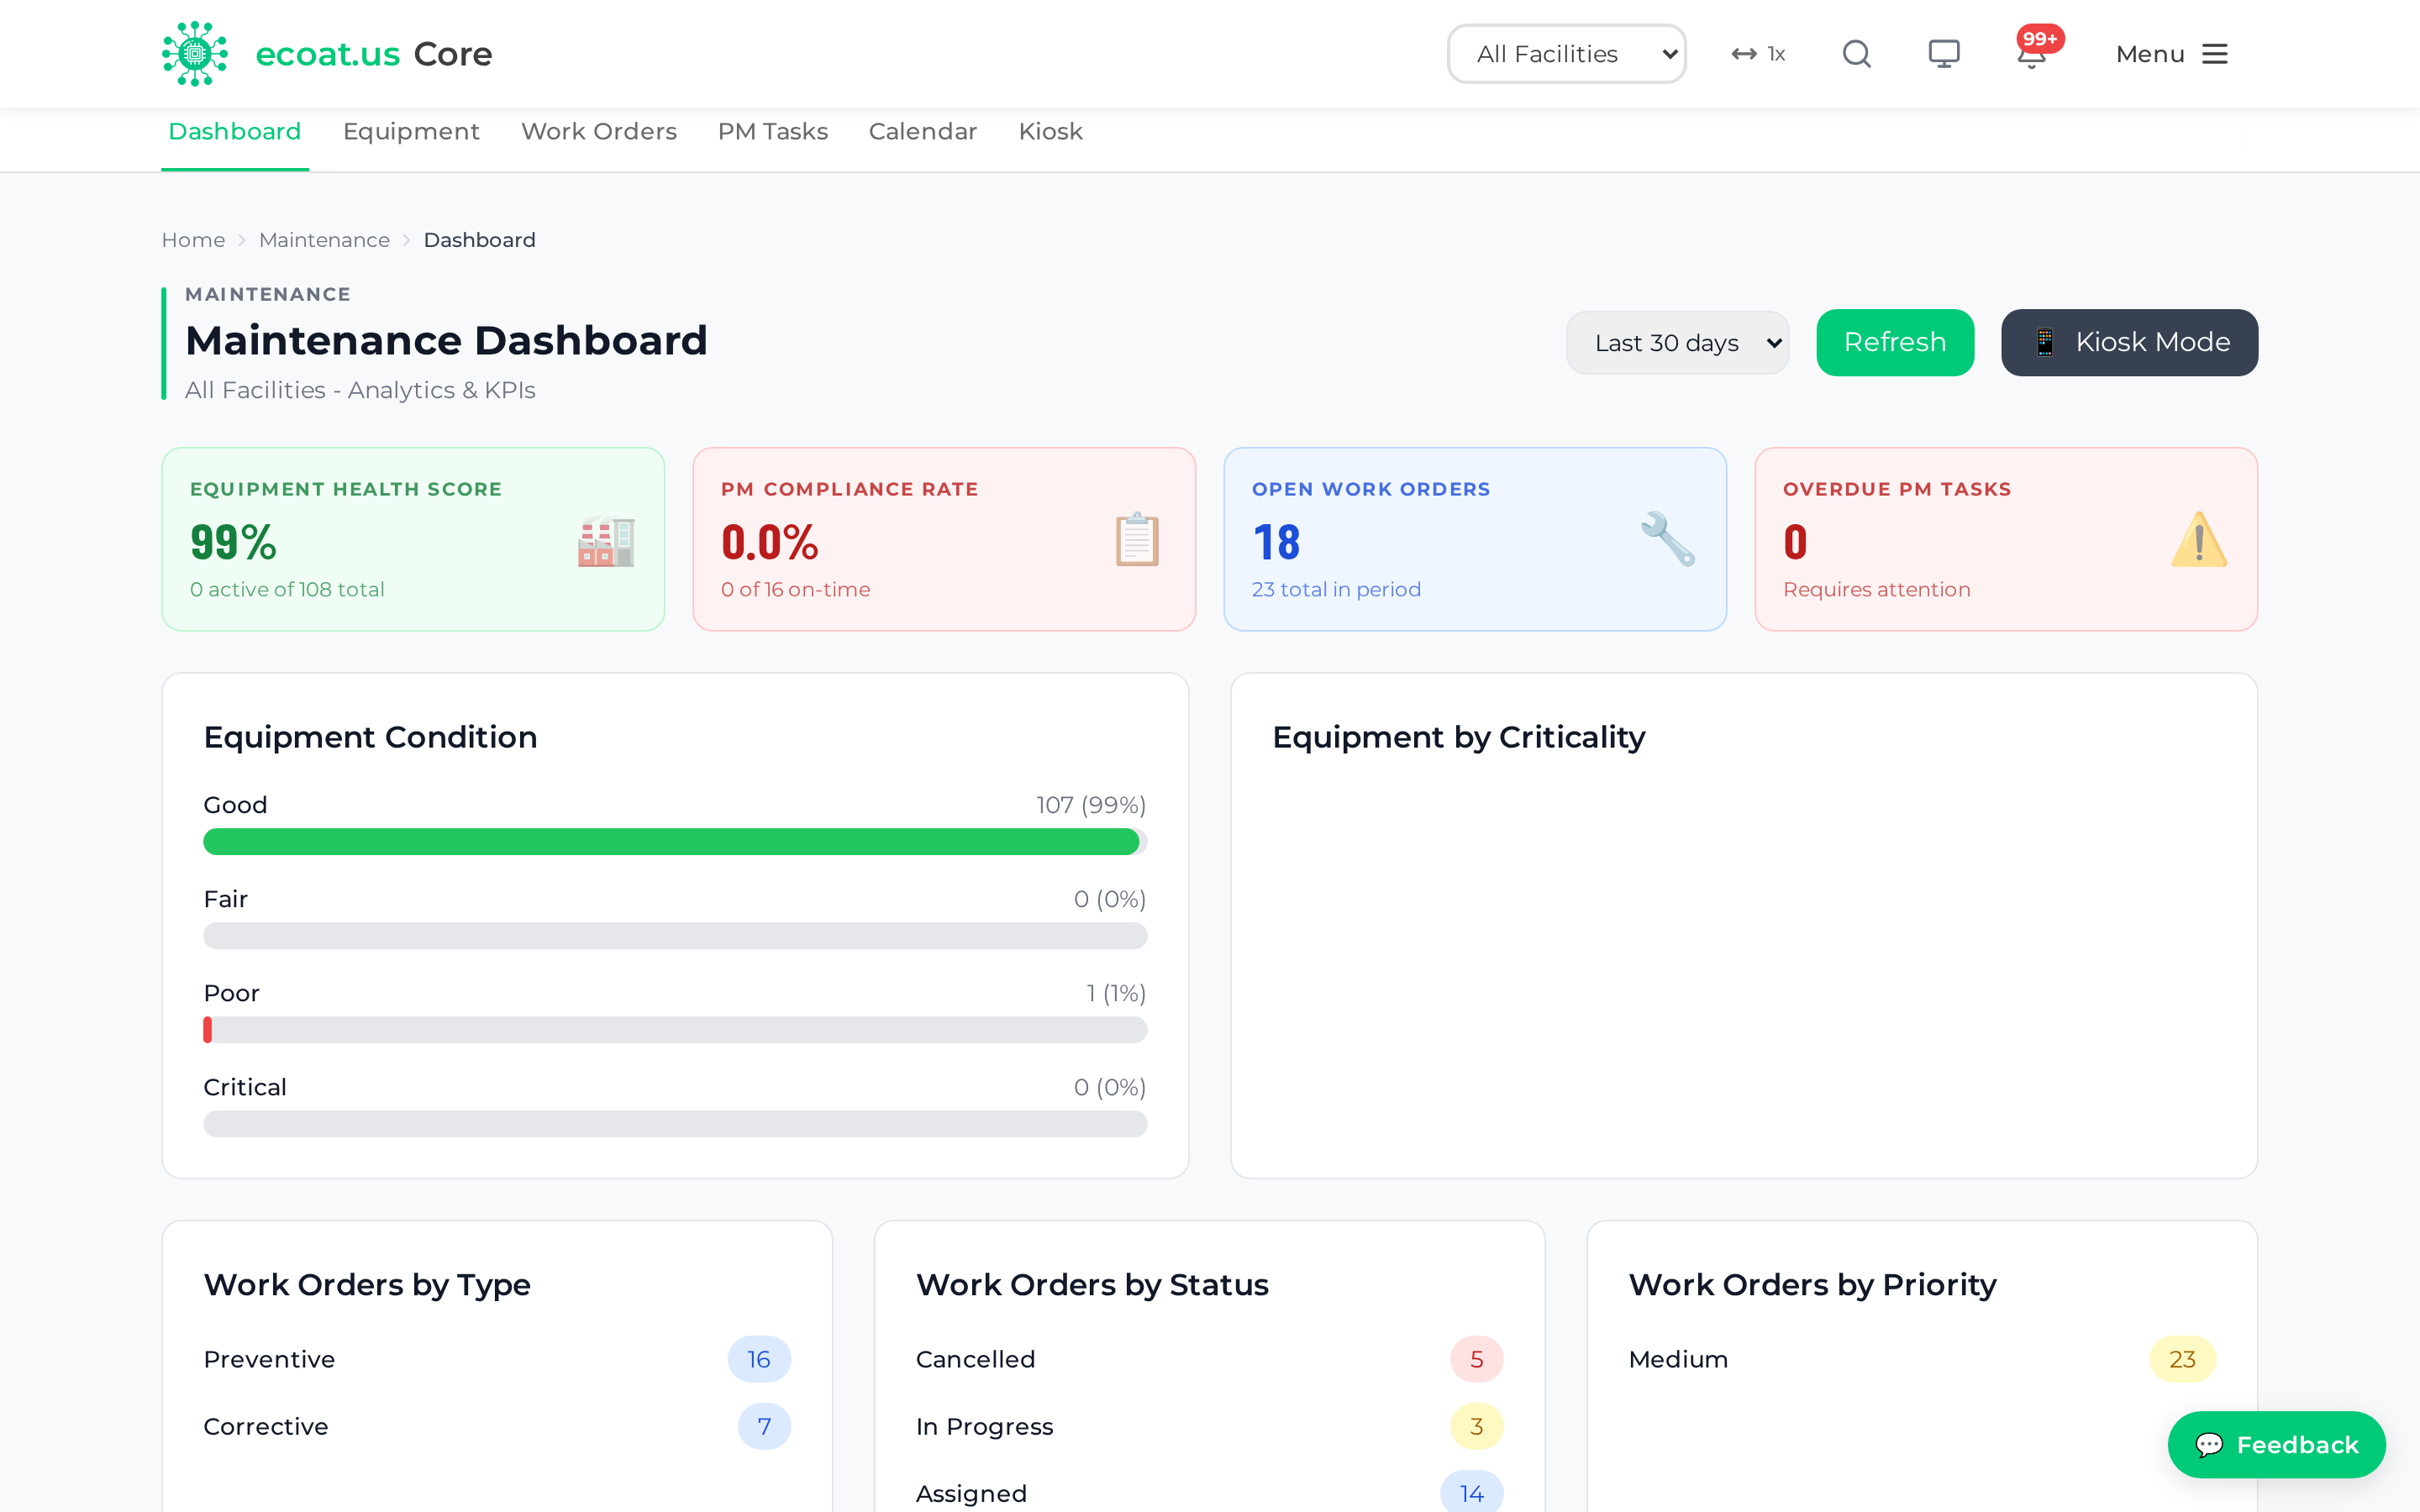
Safety
Safety
The Safety module covers four pillars: incidents and OSHA recordkeeping, SDS and Right-to-Know, recurring safety tasks, and monthly PPE audits. Reporting an incident, looking up a chemical, and recording a PPE observation all live here.
Everything sits under the Safety tab. Opening it takes you to the Safety Hub — the one screen that shows all four pillars at once. The rest of the module is reached from the Hub or from the sub-navigation, where related pages are collected under dropdowns: Incidents ▾, SDS ▾, PPE Audits ▾, and Configure ▾.
Permissions: The Safety tab appears for accounts with the Safety module. The pages are defensive anyway — anyone who reaches a Safety URL without that module gets a read-only view: the incident queue is marked "view only", and the approve/reject, 300A certification, and establishment-hours controls are hidden.
Safety Hub
The Hub is the home screen for Safety. It answers "how are we doing?" for the whole module in one glance, and every panel is a link into the page behind it.
What you'll see
- A Scope row of pills — Corporate (all facilities rolled up) or a single facility — plus a Year dropdown.
- Incidents — Open, Reportable, and Days Since Recordable. Click through to the incident queue.
- OSHA Rates — TRIR and DART for the selected year, on the 200,000-hour base. Click through to Injury Metrics.
- SDS Library — Expired, Missing File, Review Due, and Current counts.
- Safety Tasks — Overdue and Due Soon, from the Safety Calendar.
- A PPE Compliance strip along the bottom — observations this month, compliance percentage, areas needing attention, and a PASS / FAIL badge.
A Report Incident button sits in the top right, so the fastest action is never more than one click away.
Tip: Numbers show as — when there's nothing to compute from, and PPE shows No data on a corporate rollup or a month that hasn't started. A dash means "not measured", not "zero".
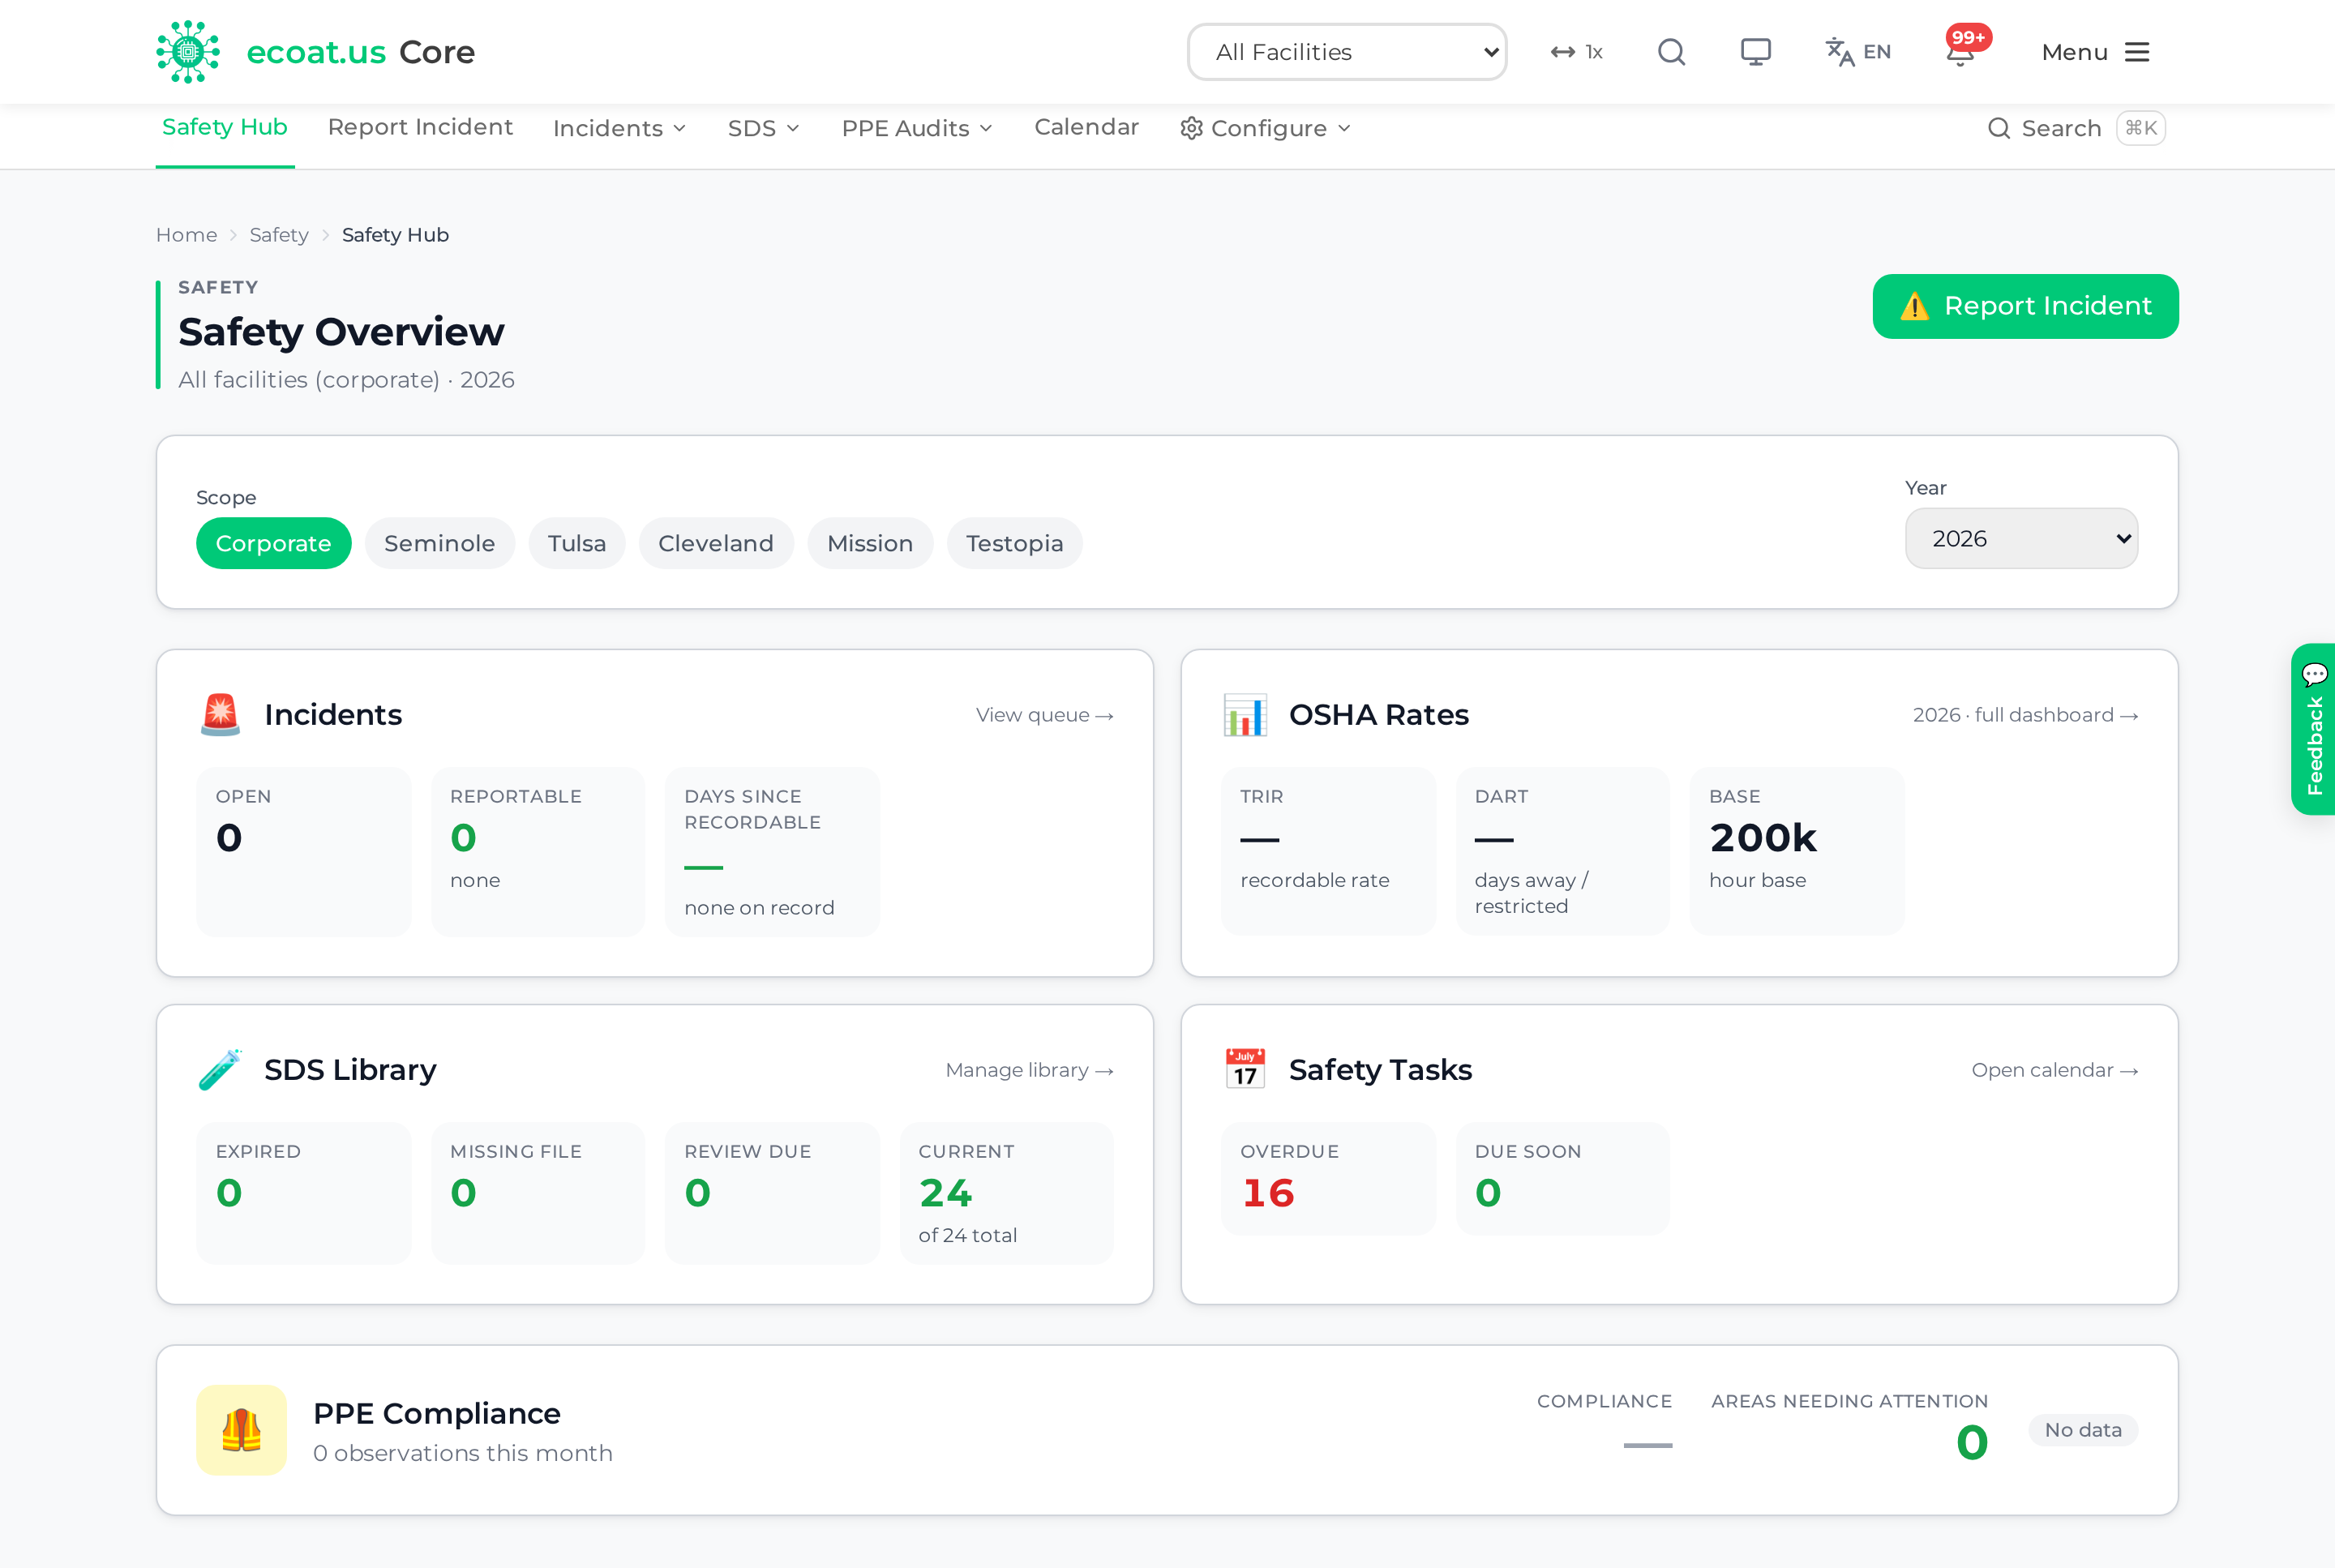
Report an Incident
This is the fast capture form for anything that happened or nearly happened — an injury, a near miss, a spill, or an unsafe condition. It's built for a phone and takes well under a minute.
Get there: Safety → Report Incident, or the Report Incident button on the Hub.
Report something
- Tap what happened: Injury / Illness, Near Miss, Property Damage, Environmental, First Aid, or Unsafe Condition.
- Pick the Facility and the Date (today by default; future dates aren't accepted).
- Add the Location / Area — e.g., "E-coat line, dock 2, blast booth".
- Describe what happened — plain words are fine.
- Optionally add a photo (the camera opens directly on a phone).
- Tick Report anonymously if you'd rather your name wasn't attached.
- Tap Submit Report.
You get a confirmation with the incident number, and buttons to Report another or open All incidents.
Tip: If it doesn't fit any category, that's what Near Miss and Unsafe Condition are for. Reporting it beats not reporting it.
Incidents
The incident queue is the EHS investigate board — every report, filterable, with the severe-event reporting clock on top.
Get there: Safety → Incidents ▾ → Incidents.
What you'll see
- A severe-event alert strip for open fatalities, in-patient hospitalizations, amputations, and eye losses. It counts down the OSHA reporting deadline live — 8 hours for a fatality, 24 hours for the others — and turns to OSHA REPORT OVERDUE when it runs out.
- Filters for Search, Facility, Type, and Recordable, plus a status filter.
- A Board / Table toggle — the board groups incidents into columns by status, the table lists them with incident number, type, status, facility, location, date, and flags.
Click any incident to open its detail page and work it.
Status lifecycle
Reported → Investigating → Corrective Action → Closed
Tip: Filter to Recordable before you sit down with the OSHA log — those are the cases that have to appear on it.
OSHA 300 Log
This is where the OSHA forms come from. OSHA 300, 300A, and 301 are filed per establishment, so the page does nothing until you pick a facility.
Get there: Safety → Incidents ▾ → OSHA 300 Log.
Generate the forms
- Choose the Establishment (facility) and the Year.
- Review the 300 Log Preview — the recordable cases for that facility and year, with case number, employee, job title, date, location, classification, and days away/restricted.
- Click Download 300 Log (PDF) for the log itself.
- Click ITA CSV Export for the electronic-submission file.
- For the annual summary, use Certify & download 300A Annual Summary and fill in the certifier's name, title, and phone. Without Safety module access you can still take Download 300A Summary (uncertified), which comes out with blank signature lines.
Each case row also offers a 301 Incident Report PDF download.
Establishment Hours — the thing people forget
The Establishment Hours block holds the average number of employees and total hours worked for the year. That's the denominator for every rate in the module.
Without it, TRIR and DART cannot be calculated and Injury Metrics shows dashes. Enter it once a year and the rates start working.
Tip: The 300A has to be certified and posted between February 1 and April 30. Enter the prior year's hours in January so the summary is ready to certify.
Injury Metrics
The rate dashboard. Same numbers OSHA and your insurer ask for, on the standard 200,000-hour base.
Get there: Safety → Incidents ▾ → Injury Metrics. (The page titles itself "Safety Dashboard".)
| Rate | What it measures |
|---|---|
| TRIR | Total Recordable Incident Rate |
| DART | Days Away / Restricted / Transfer |
| LTIR | Lost Time Injury Rate |
| Severity | Severity rate, from lost days |
| Near-Miss | Near-miss to recordable ratio |
Below the rates sits the raw arithmetic — Hours Worked, Avg Employees, Total Incidents, Recordable, Restricted/Transfer, and the 200,000 Rate Base — so anyone can check the maths.
Then three views: a Days Since Last Recordable board across facilities, a Monthly Case Trend chart, and a Rate Trend chart. A Corporate / facility scope toggle and a year dropdown drive all of it.
If an amber banner says rates are unavailable, no hours have been recorded for that scope — fix it on the OSHA 300 Log.
Tip: A high near-miss ratio is good news. It means people are reporting the close calls instead of only the injuries.
SDS Library
The SDS Library is your master list of Safety Data Sheets and the currency status of each one.
Get there: Safety → SDS ▾ → SDS Library.
The five tiles across the top — Total, Current, Review Due, Expired, Missing File — double as filters. Click one to narrow the table to it.
Find a sheet
- Search by product, manufacturer, or MFG part #.
- Or filter by Facility in use.
- Click a row to open the SDS detail page.
Add a sheet
- Click Add SDS.
- Optionally link an inventory chemical first — it prefills the fields for you.
- Fill in Product Name (required), plus manufacturer, MFG part #, revision date, version label, and source as you have them.
- Review Due defaults to three years out.
- Attach the SDS PDF.
Tip: Work the Expired and Missing File tiles first. A sheet nobody can open is the same as no sheet at all in an inspection.
Missing SDS
This report is the gap list: chemicals your inventory says you have, with no current Safety Data Sheet behind them.
Get there: Safety → SDS ▾ → Missing SDS.
A single count tile tells you how many chemicals are uncovered — green when it's zero. The table lists the chemical, MFG part #, vendor, quantity on hand, and which facilities hold it.
The Add SDS button on each row jumps to the library with that part number already filled in, so closing a gap is two clicks.
Chemical Requests
This is the intake form for bringing a new chemical on site. It's a soft gate — it surfaces and tracks the request, it doesn't block anyone from doing their job.
Get there: Safety → SDS ▾ → Chemical Requests.
Request a chemical
- Click Request a chemical.
- Enter the Product Name (required), Facility, and MFG Part #.
- Describe the Intended Use — what it's for, where, and how much.
- Answer SDS on hand?
- Submit.
Anyone signed in can raise a request. EHS reviews the queue.
Statuses
| Status | Meaning |
|---|---|
| Submitted | Raised, not yet looked at |
| Needs SDS | Accepted, waiting on a Safety Data Sheet |
| In Review | EHS is working it |
| Approved | Cleared for use |
| Rejected | Declined (with an optional reason) |
EHS reviewers get Approve and Reject buttons on each card, plus a Create SDS shell on approve option that opens the matching SDS record for you.
Tip: No SDS yet is fine — say so. Flagging it is what gets EHS sourcing the sheet.
Right-to-Know
The Right-to-Know kiosk is an oversized SDS finder for the floor — a wall-mounted tablet or a shared terminal. Big type, big touch targets, read-only.
Get there: Safety → SDS ▾ → Right-to-Know.
- Type into Search chemical — product name, manufacturer, or part number.
- Narrow by Facility if you need to.
- Tap a result card to Open SDS — the PDF opens in a new tab.
Each card also carries GHS label, which opens the secondary-container label PDF, and Show QR, which brings up a Station QR image to print and post at the workstation so people can scan straight to that sheet.
Cards carry the same currency badge as the library, so an operator can see at a glance whether the sheet is current.
Note: The kiosk is read-only, but it still runs inside a signed-in session — it isn't a login-less public page. Leave the tablet signed in.
Safety Calendar
The calendar holds the recurring safety work — booth inspections, fit tests, ventilation checks, training, air monitoring, emergency-equipment checks, SDS reviews.
Get there: Safety → Calendar.
- Tasks sit on the month grid by their next due date, coloured by category.
- Overdue tasks are carried onto today in red so they can't quietly slide off the back of the month.
- A summary strip above the grid counts what's overdue and what's due.
- Click a task to open its drawer and Edit, Complete, or Delete it.
Add a task
- Click Add task.
- Enter a Title — e.g., "Booth & emergency-gear check".
- Set Facility, Next due, Category, Frequency (Every Shift, Weekly, Monthly, Quarterly, Annually, or One Time), and Priority.
- Add an Owner and Owner email so it has a name against it.
- Click Create task.
Tip: Marking a recurring task Complete rolls its next due date forward automatically — you never re-create it. Delete deactivates a task and takes it off the calendar rather than erasing its history.
PPE Audits
The PPE pillar runs your monthly PPE (personal protective equipment) audits. Each month you walk the floor, record whether people are wearing the gear their area requires, and the system tallies up whether the facility passes. It keeps a running history so you can see how compliance trends over time.
Its four pages live under Safety → PPE Audits ▾.
PPE Dashboard
The dashboard is the home base for the current month's audit at your facility.
Get there: Safety → PPE Audits ▾ → PPE Dashboard, or the PPE Compliance strip at the bottom of the Safety Hub.
What you'll see
- A Facility Compliance card with the overall compliance percentage and a pass/fail badge
- An Areas list — each area's observed count against its minimum, its compliance percentage, and its pass/fail status
- The period status line: Open or Completed, and who completed it
Run a monthly audit
- Select your facility from the header dropdown.
- Click Open New Month to start the current month. (The button only appears when no period exists yet for that month.)
- Click Start Observations and record on the floor throughout the month.
- When every area has met its minimum, a green Complete Audit button appears. Click it to finalize the month.
Complete Audit stays hidden until every area has hit its minimum sample. If you can't see it, an area is still short — check the Areas list for the one that hasn't filled up.
What counts as passing
A facility passes the monthly PPE audit only when all three of these are true:
- Overall compliance is 95% or higher
- Every area is at 95% or higher
- Every area has met its minimum sample size
The minimum is 4 observations per area per month — roughly one a week — capped at the area's headcount, so a two-person area only ever needs two. An area with a headcount of 0 needs none and doesn't hold the audit up.
Tip: Don't leave all your observations to the end of the month. Record one a week per area and the minimum takes care of itself.
Record Observations
This is the mobile-first form you use on the floor. It's built for phones and tablets and stays put on your selected area so you can log people one after another.
Get there: Safety → PPE Audits ▾ → Record Observations, or Start Observations on the PPE Dashboard.
You need an open audit period first. If there isn't one, the page says so and sends you back to open the month.
Record a single observation
- Select the Area. Its supervisor, required PPE, and minimum required fill in automatically.
- Tap the big Compliant or Non-Compliant button for the person you're observing.
- If non-compliant, tap the Missing PPE Items they aren't wearing.
- Optionally add Person Name, Person Type (Employee, Temp, Contractor, Visitor), and Comments.
- Tap Save Observation.
After each save the form offers a photo — Take Photo, Browse, or Skip — and then resets for the next person while keeping your area selected. That's what makes batch logging fast: pick the area once, then work through people.
A running Observations this session count sits above the buttons so you know when you've hit the area's minimum.
Filling in non-compliance details
When you mark someone Non-Compliant:
- Missing PPE Items — tick each item not being worn (e.g., Safety Glasses, Steel Toes)
- Signage Present — toggle on if the area's PPE signage was up
- Corrective Action Taken — toggle on if you fixed it on the spot
- Coaching Completed — toggle on if you coached the person on the requirement
- Comments — any extra notes
Tip: Recording the name and ticking "Coaching Completed" turns a bare number into a paper trail you can stand behind in a safety review.
Area Summary
The Area Summary breaks a month down area by area so you can see exactly which spots are dragging compliance down.
Get there: Safety → PPE Audits ▾ → Area Summary.
For a chosen facility and month it shows, per area: supervisor, headcount, minimum required, observed, compliant, non-compliant, compliance percentage, and pass/fail. Compliance is colour-coded — green at 95%+, amber 90–94%, red below 90%.
Click any area row to expand it and see the individual observations behind the numbers, including what was missing, whether corrective action and coaching happened, and any attached photos. You can also + Add photo to an observation after the fact.
History
The History page shows compliance trends month over month so you can spot patterns instead of just reacting to the current month.
Get there: Safety → PPE Audits ▾ → History.
- A monthly results table lists observed, compliant, non-compliant, compliance percentage, and pass/fail for each month.
- A Compliance Trend chart plots the same data against a 95% target line.
- Click any month to drill into that period's Area Summary.
Tip: Watch for seasonal dips — a recurring drop in the same month often points to a specific job, crew rotation, or piece of gear that needs a second look.
Config
The Config screen defines what each area requires — its headcount, its required PPE, and its supervisor. Getting these right is what makes every audit accurate.
Get there: Safety → Configure ▾ → Config.
Click Add Area, or Edit on an existing row, to set:
- Area Name — required
- Headcount — number of employees in the area
- Default PPE Requirements — the required items, comma-separated (e.g., "Safety Glasses, Hard Hat, Gloves")
- Supervisor — the supervisor's name, filled in automatically on observations
- Active — toggle to include or exclude the area from audits
The Min Required column is calculated for you from the headcount — you can't set it directly. Change the headcount to change the minimum.
ZNET
ZNET
ZNET is the production-intelligence side of ECOAT Core — it turns your coating-line data into dashboards you can actually use. Every time a bar of parts runs through the line, the line records how much square footage it coated, how many amp-hours it drew, how efficient it was, how the anodes behaved, and more. ZNET collects all of that and shows you production totals, run histories, line diagnostics, statistical process-control charts, anode health, and printable reports.
If you've used the standalone "ZStats" app before, ZNET is that same intelligence, now built into Core.
You'll find it under the ZNET tab (its icon is the ⚡ lightning bolt).
Permissions: ZNET is facility-scoped. Most people see only their own plant's data. Multi-facility users and admins also get the fleet-wide Global ZNET Operations view. If you have no ZNET access at all, the tab and its Home-page card simply don't appear. The rest of this chapter notes which view you'll land in.
What ZNET is watching
ZNET is built around the electrocoat line. The data it shows comes straight off each run:
- Runs — every bar of parts that goes through the line, with its customer, part number, operator, square footage, amp-hours, and cycle time.
- Efficiency — how much coating you get per amp-hour (sqft/Ah) and per paint-hour (throughput).
- Anodes — the health of the anodes in the tank, scored over time so you can replace them before they fail.
- SPC (Statistical Process Control) — control charts that flag when the process drifts out of its normal range.
- Reports — printable PDF/CSV summaries you can file or email.
Fleet Overview (Global)
If you have fleet access, ZNET opens on the Global ZNET Operations view — a single screen comparing every plant. The heading reads Global ZNET Operations, with month arrows to step back and forward.
You'll see:
- Fleet Totals — combined production across all plants for the month.
- Efficiency Comparison — a table ranking plants by Amp-Hr Eff (sqft/AH), Throughput (sqft/paint-hr), Paint Hrs, Amp Hrs, and Runs, plus a Data Quality indicator (a "Data OK" flag warns when a plant is missing cycle-time data).
- Anode Health — a fleet-wide roll-up of healthy / warning / critical anodes.
- Per-plant cards — each plant shows its Today and MTD (month-to-date) numbers and a live status line. When a line is mid-run, the card shows Running, the elapsed time, the active anode count, and the current amperage; otherwise it shows idle or offline.
Click any plant to drill into its per-facility view.
Tip: The Data Quality column is worth a glance before you trust the efficiency ranking — a plant that's missing cycle times can look artificially good or bad.
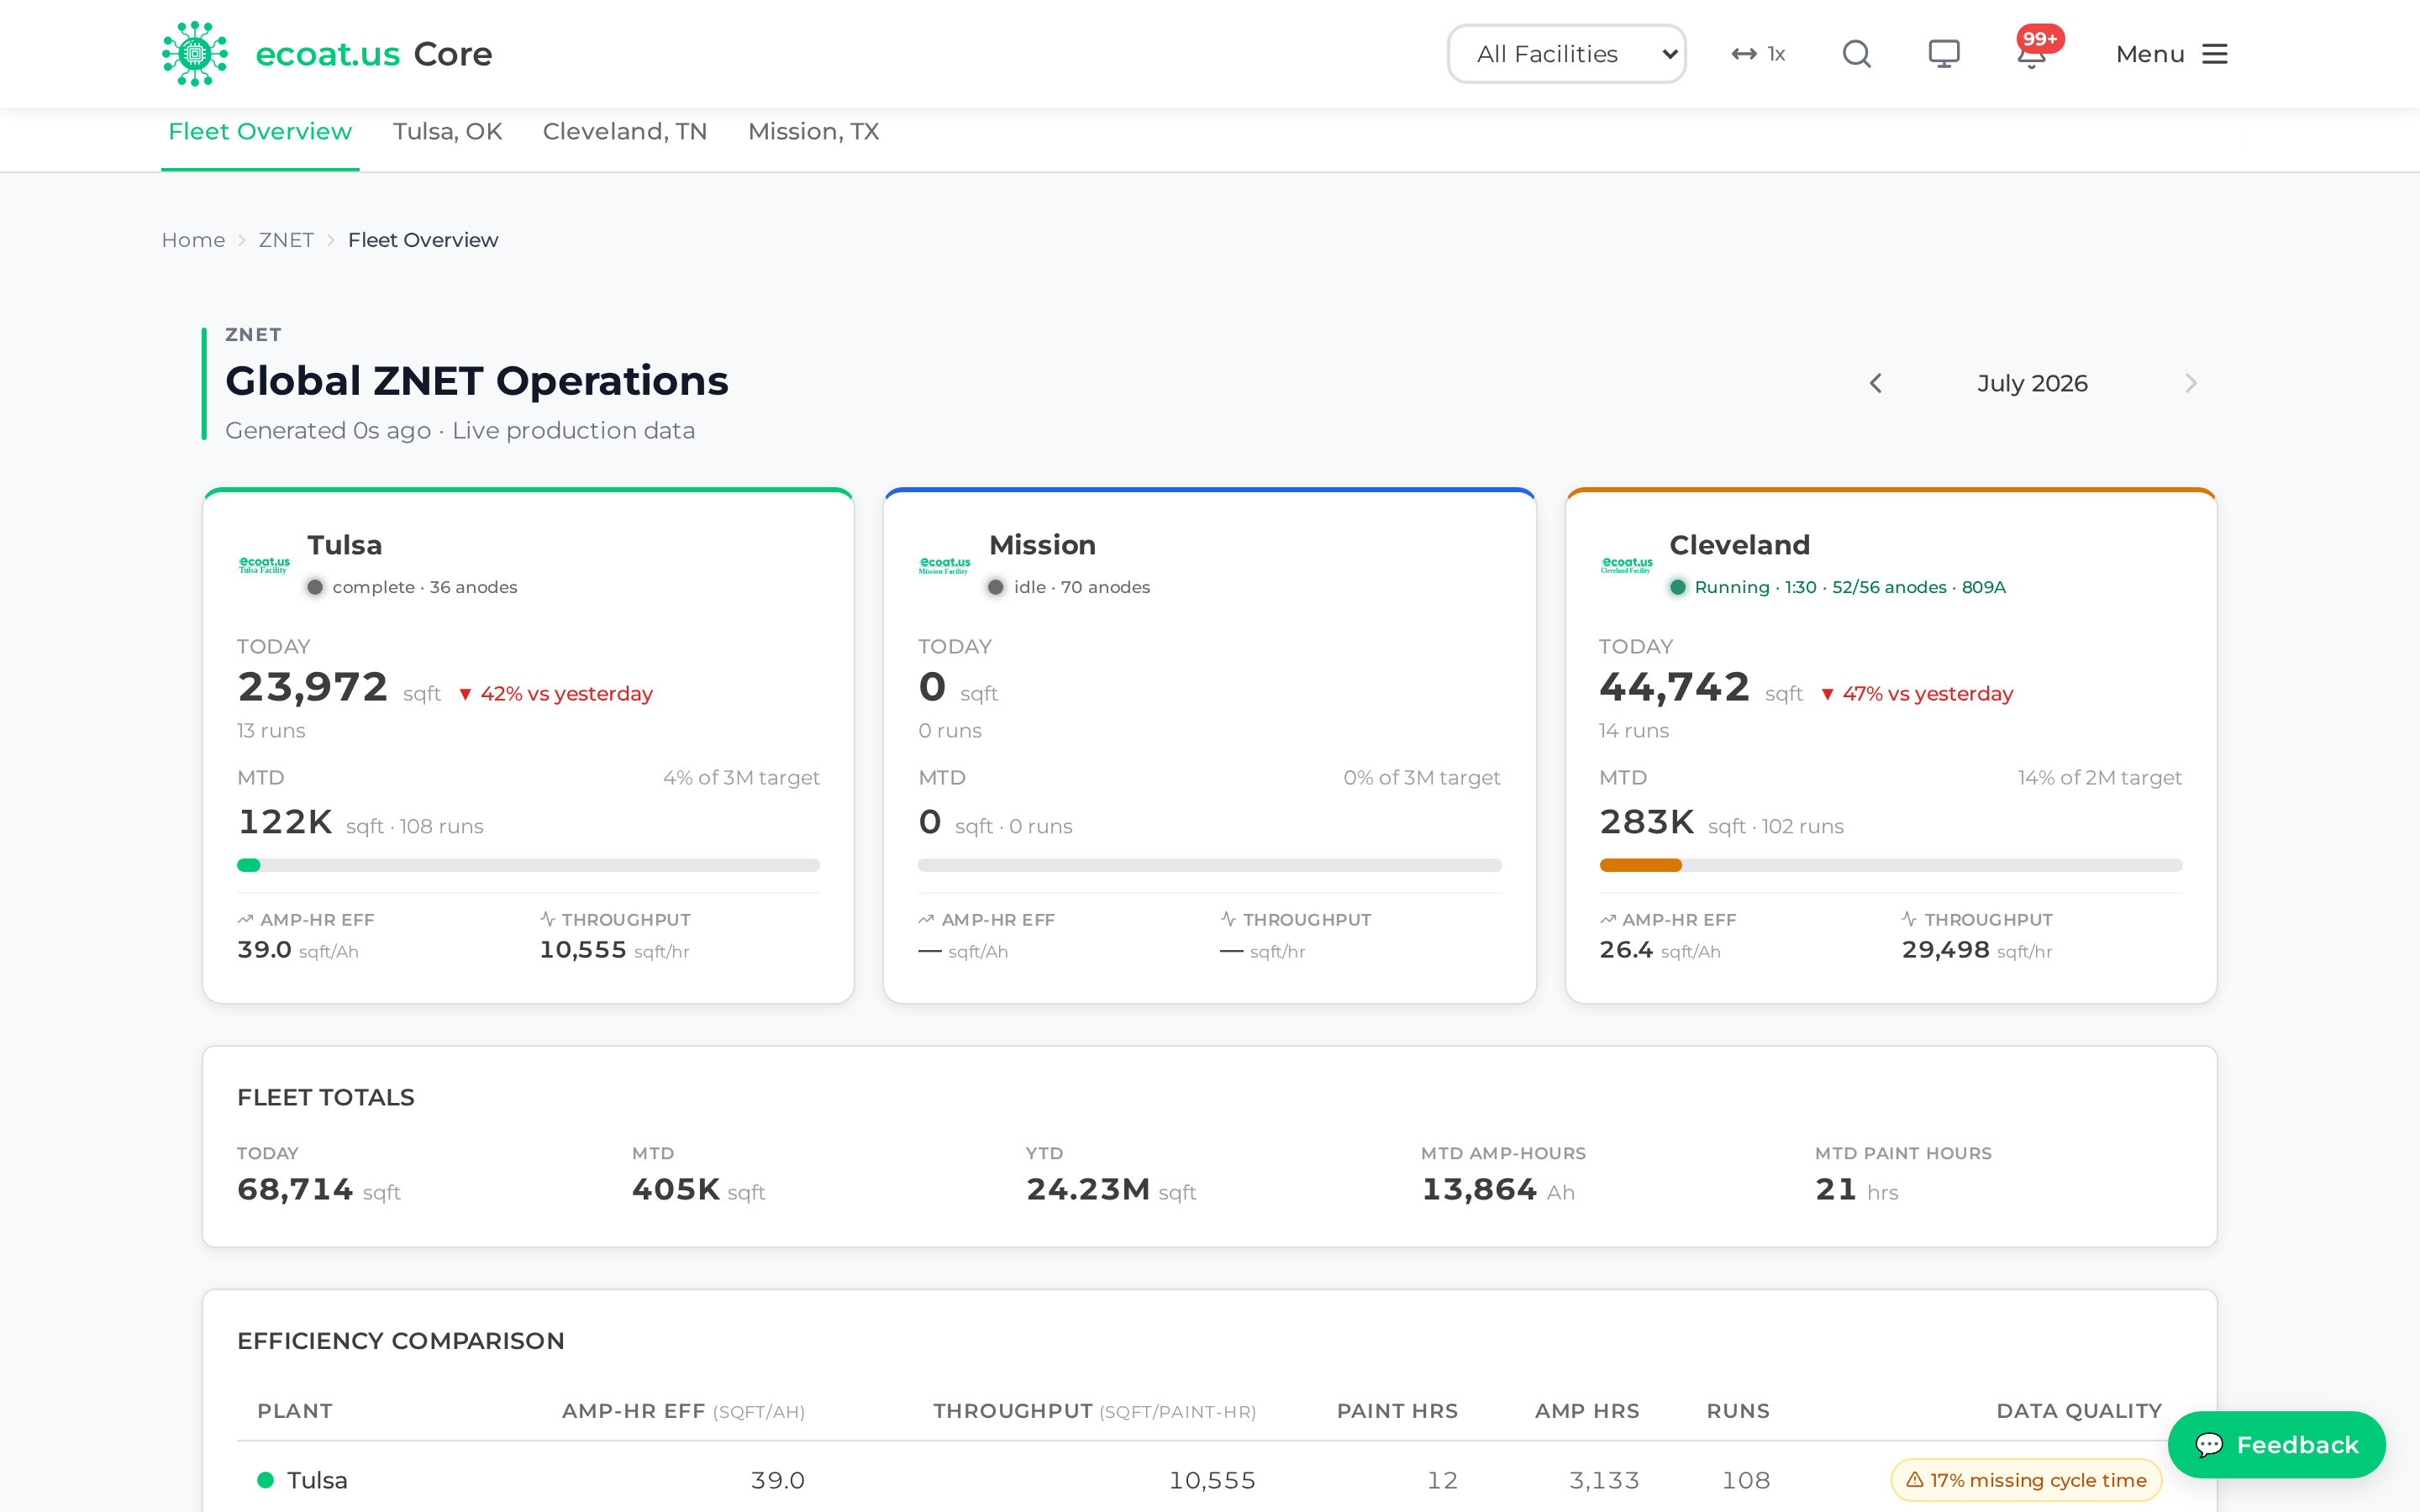
A single plant's view
Single-facility users land straight on their own plant. However you get here, a plant's data is organized into six tabs across the top:
| Tab | What it shows |
|---|---|
| Dashboard | This month's production at a glance |
| Run Log | Every individual run, searchable |
| Diagnostics | Efficiency trends and operator performance |
| SPC | Statistical process-control charts |
| Anodes | Anode health grid for the tank |
| Reports | Generate printable PDF/CSV reports |
Dashboard
The plant Dashboard shows the current month's Monthly Production totals with month arrows to move between periods. Headline figures include Today, This Week, Runs, Avg / Run, Avg Cycle Time, Amp-Hours, Amp-Hr Eff, Throughput Eff, and Rework Rate, along with a daily production trend.
Run Log
The Run Log lists every run for the month in a sortable table. Columns are Run #, Date, Customer, Part #, SqFt, Amp-Hrs, and Operator. Use Search runs… to find a specific run, customer, or part, and click a column header to sort. Runs pulled automatically from the line are tagged "Auto-logged run from ZNET Web."
Diagnostics
Diagnostics digs into why the numbers look the way they do. It shows a Coating Efficiency trend and an Operator Performance table with each operator's Total SqFt, Runs, Avg SqFt/Run, Avg Cycle, and Rework %.
SPC (Statistical Process Control)
The SPC Control Charts tab tells you whether the process is behaving. Pick a metric — Efficiency or Current Imbalance — a time window (7, 30, or 90 days), and a chart type (EWMA or CUSUM). The chart plots each run against calculated control limits and flags any points that break the control rules, so a drift shows up before it becomes scrap. A Cpk capability badge summarizes how well the process is holding to spec.
Tip: EWMA is best for catching small, gradual drifts; CUSUM highlights a sustained shift away from the target. If a metric trips a violation, check the Run Log and Diagnostics for that period to find the cause.
Anodes
The Anodes tab shows the health of every anode in the tank. Each anode gets a health score and a status — Healthy, Warning, Critical, or Inactive (never fired). A Range selector lets you score anodes over a specific date range. Click any anode to open its detail page, which shows its cumulative amp-hours, percent of life remaining, an estimated replacement date, and its recent cycle history.
Tip: Watch anodes that slide from Healthy into Warning — replacing one on a planned basis is far cheaper than a Critical failure that halts the line.
Reports
The Reports tab generates printable production reports you can save or email. Choose a Report Type:
- Monthly Summary — a full monthly production report with the KPI summary, daily breakdown, operator performance, and run statistics. Available as PDF or CSV.
- Anode Heat-Map — a date-range snapshot of anode health as a colour-coded grid, with per-anode scores and amp-hours and a worst-first ranking table. PDF only.
Pick the month (or date range for the heat-map), choose the format, and click Generate Production Report. The file downloads to your device.
The Home-page ZNET card
Your Home dashboard carries a ZNET card (⚡) so you get the headline without opening the module. What it shows follows your scope:
- Single-facility users see their plant name, its MTD sqft and Today totals, MTD runs, and an Anode alerts line counting critical and warning anodes.
- Fleet users see "Fleet production intelligence" with the fleet totals plus a one-line-per-plant breakdown, each showing MTD sqft and any anode alerts.
Click the card to jump straight into ZNET — to your plant if you're single-facility, or to the Global view if you have fleet access. If the data is briefly unavailable, the card says so rather than showing stale numbers.
Permissions: The card only appears if you have ZNET access, and it always respects your facility scope — you'll never see a plant on it that you can't open.
IT
IT
The IT module is your help desk. When something's broken — a login won't work, a printer's offline, an app is misbehaving — this is where you file a ticket and track it to resolution. It also holds a searchable FAQ of answers to common questions, and (for IT staff) a Devices registry of the company's enrolled machines.
You'll find it under the IT tab. Opening it drops you on the Help Desk by default. Everything here is available to any signed-in user; a few staff and admin screens are noted along the way.
Getting help fastest
Before you file a ticket, it's worth a 10-second look at the FAQ — if the answer's already there, you're unblocked immediately. If it isn't, filing a ticket takes under a minute. Here's the quick path:
- Open the IT tab.
- Check the FAQ for your issue.
- If it's not answered, click Submit an IT request and describe the problem — the more detail, the faster it gets solved.
Tip: A good ticket names the device or app, what you were doing, and the exact error message. That's usually the difference between a same-day fix and a day of back-and-forth.
Help Desk — the ticket queue
The Help Desk (/it/helpdesk) lists IT tickets so you can see what's open and what's been done.
- Search by subject or requester with the search box ("Search subject, requester…").
- Filter by status (Open, In Progress, Waiting on User, Resolved, Closed — plus All statuses) and by priority (All priorities, or Low/Medium/High/Urgent).
- Each row shows the Ticket, Subject, Status, Priority, and whether it's Assigned or Unassigned.
Click any ticket to open its detail page.
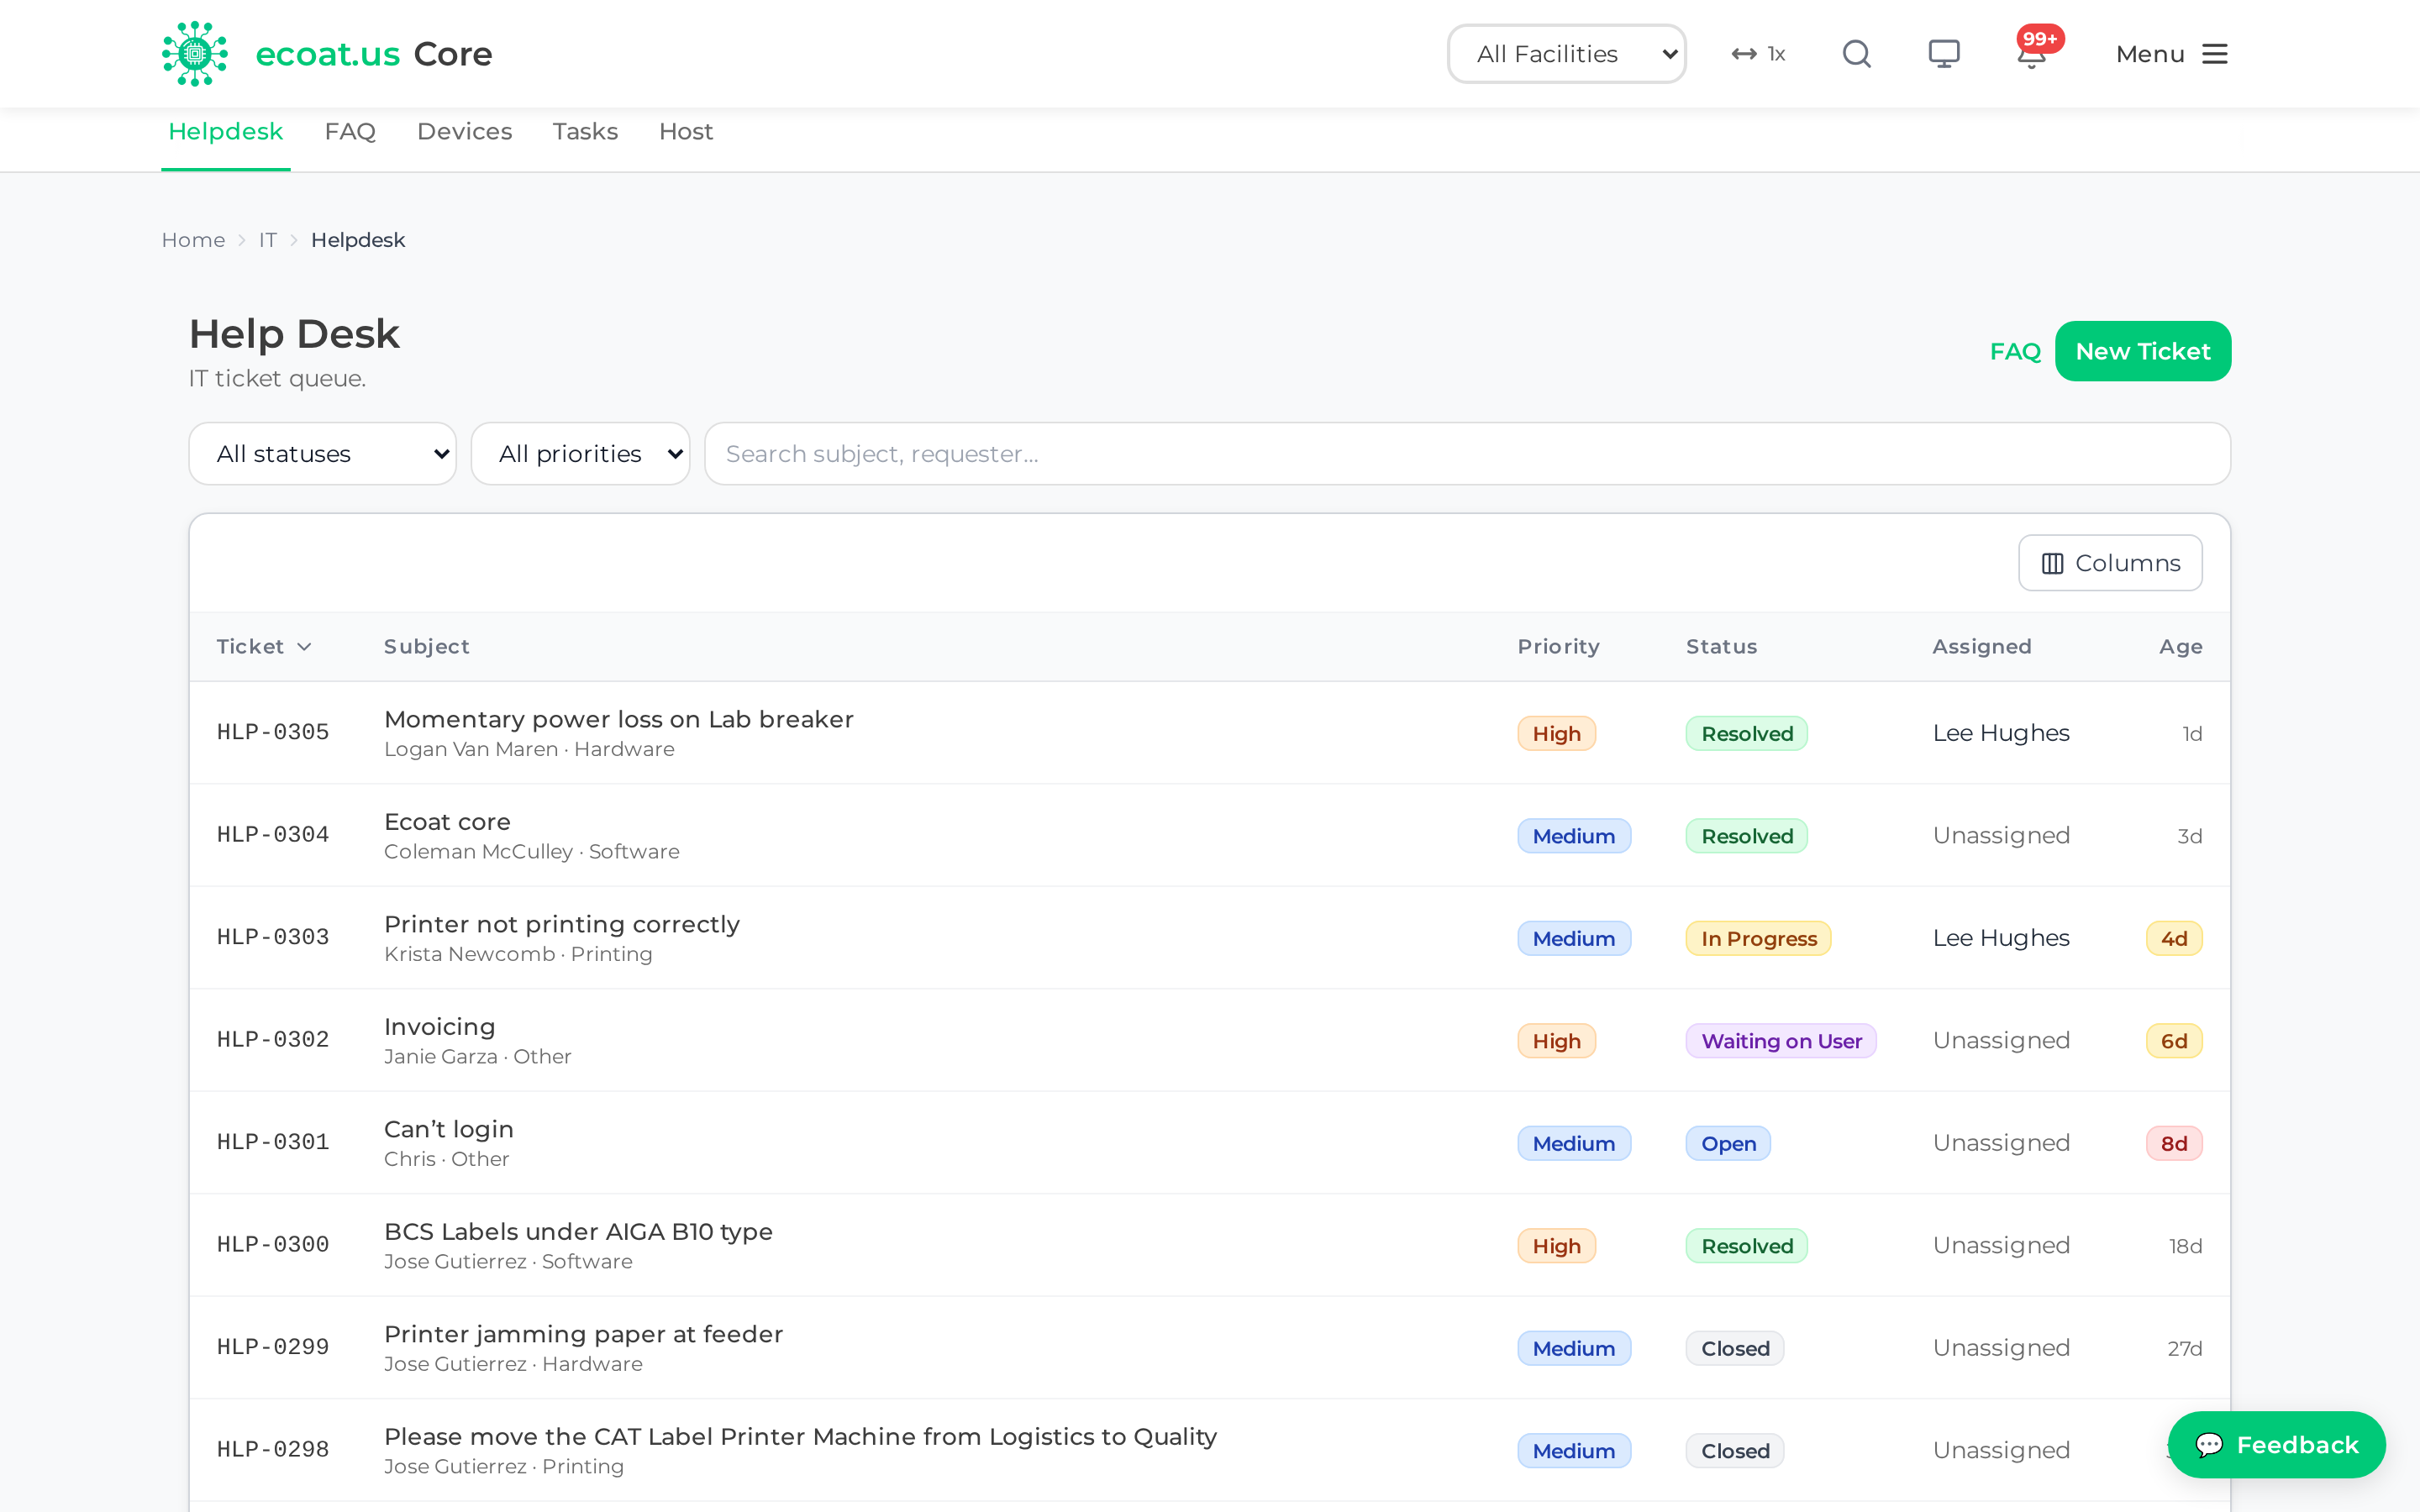
Create a ticket
Click "Submit an IT request" (/it/helpdesk/new) to file a new ticket. The form is short:
- Subject — a short summary of the problem.
- Category — pick the area it falls under from the dropdown.
- Priority — Low, Medium, High, or Urgent (defaults to Medium).
- Description — the details. The prompt asks: "What happened? Any error messages, and which device/app?"
- Submit.
Below the form, Your recent tickets shows what you've filed lately (or "You haven't filed any tickets yet." if you're new), so you can jump back into an existing conversation instead of opening a duplicate.
Tip: Reserve Urgent for things that stop you working entirely. Overusing it makes it harder for IT to spot the real emergencies.
Track a ticket
Open any ticket to see its full detail and conversation. The page shows the subject, current Status, Priority, and who it's Assigned to.
- The Conversation section is the running thread. Add a reply in the "Add a reply…" box to ask a question or give more information.
- You'll see updates as IT works the ticket, right through to Resolved and Closed.
Permissions: IT staff also see a Staff controls panel on the ticket, where they change status, assign the ticket, add an Internal note (not shown to the requester), and — where relevant — generate a password-reset link. Regular users just see the conversation and their own replies.
FAQ
The IT FAQ (/it/faq) collects answers to common IT questions so you can self-serve.
- Browse the list, or use Search the FAQ… to find a topic.
- Filter by category if you like.
- Click an article to read it.
At the bottom of each article, tell IT whether it helped with the Helpful / Not helpful buttons. That feedback helps them improve the answers over time.
Devices
The Devices registry (/it/devices) is IT's inventory of enrolled company machines — laptops, workstations, and kiosks across the fleet.
- The list shows each machine's Hostname, Owner, Location, Status, and Last seen, with filters for location and status.
- Click a device to open its detail page, which shows its operating system, kernel, uptime, memory, disk, pending updates, Tailscale IP, agent/service heartbeat, and a full Audit trail of actions taken on it.
Permissions: Devices is a staff screen (it needs IT-module access). Most staff can view devices and their history; retiring a device and proposing maintenance tasks are done from the detail page.
Enrolling a new device
Enrollment (/it/devices/enroll) is admin-only. It works by generating a one-time command you run on the machine being added:
- Open Devices and choose Enroll a Device.
- Fill in the Owner name, Owner email, and Location.
- Click Generate enrollment command.
- Copy the generated command and run it on the target machine — it registers the device and it then appears in the Devices list.
Permissions: The Host Dashboard and Tasks screens are additional staff tools for monitoring hosts and managing proposed device tasks. Filing tickets and reading the FAQ need no special role — everyone can do those.
Note: Unlike ZNET, IT does not have a dedicated card on the Home dashboard — you reach it through the IT tab in the top navigation. Notifications about your own tickets and feedback surface through the bell/notification area instead.
Admin & Feedback
Admin & Feedback
This chapter has two halves. The first is for everyone — what happens to the feedback you send about CORE, and how to control which notifications reach you. The second is the admin corner: a set of behind-the-scenes settings screens that only administrators can open. If you're not an admin, the admin section won't appear for you, and that's fine — you can skip to whatever you need.
What happens to the feedback you send (for everyone)
CORE has a built-in "Send feedback" button so you can tell the team what's working, what's broken, and what you'd like to see. You'll find it available throughout the app.
Send feedback
- Click Send feedback.
- Pick a category — Question, Issue, Idea, Praise, or Other.
- Type your message. If it's a problem, say what you were trying to do (the prompt reads: "What's on your mind? If it's an issue, what were you trying to do?").
- Send it. CORE automatically notes which page you were on, so you don't have to explain where you were.
What happens next
Your feedback goes into a triage queue that admins work through. When an admin replies or changes the status of your submission, you're notified — the reply lands in your email and in the app.
To see the whole conversation, open My Feedback (/feedback/mine). It lists everything you've submitted along with any replies, and you can keep the thread going with the "Add to the conversation…" box. The notification bell links you straight here.
Tip: Feedback isn't a black hole — a real person reads every item and can reply to you directly. If you're not sure whether something's a bug or just how it works, "Question" is a perfectly good category to pick.
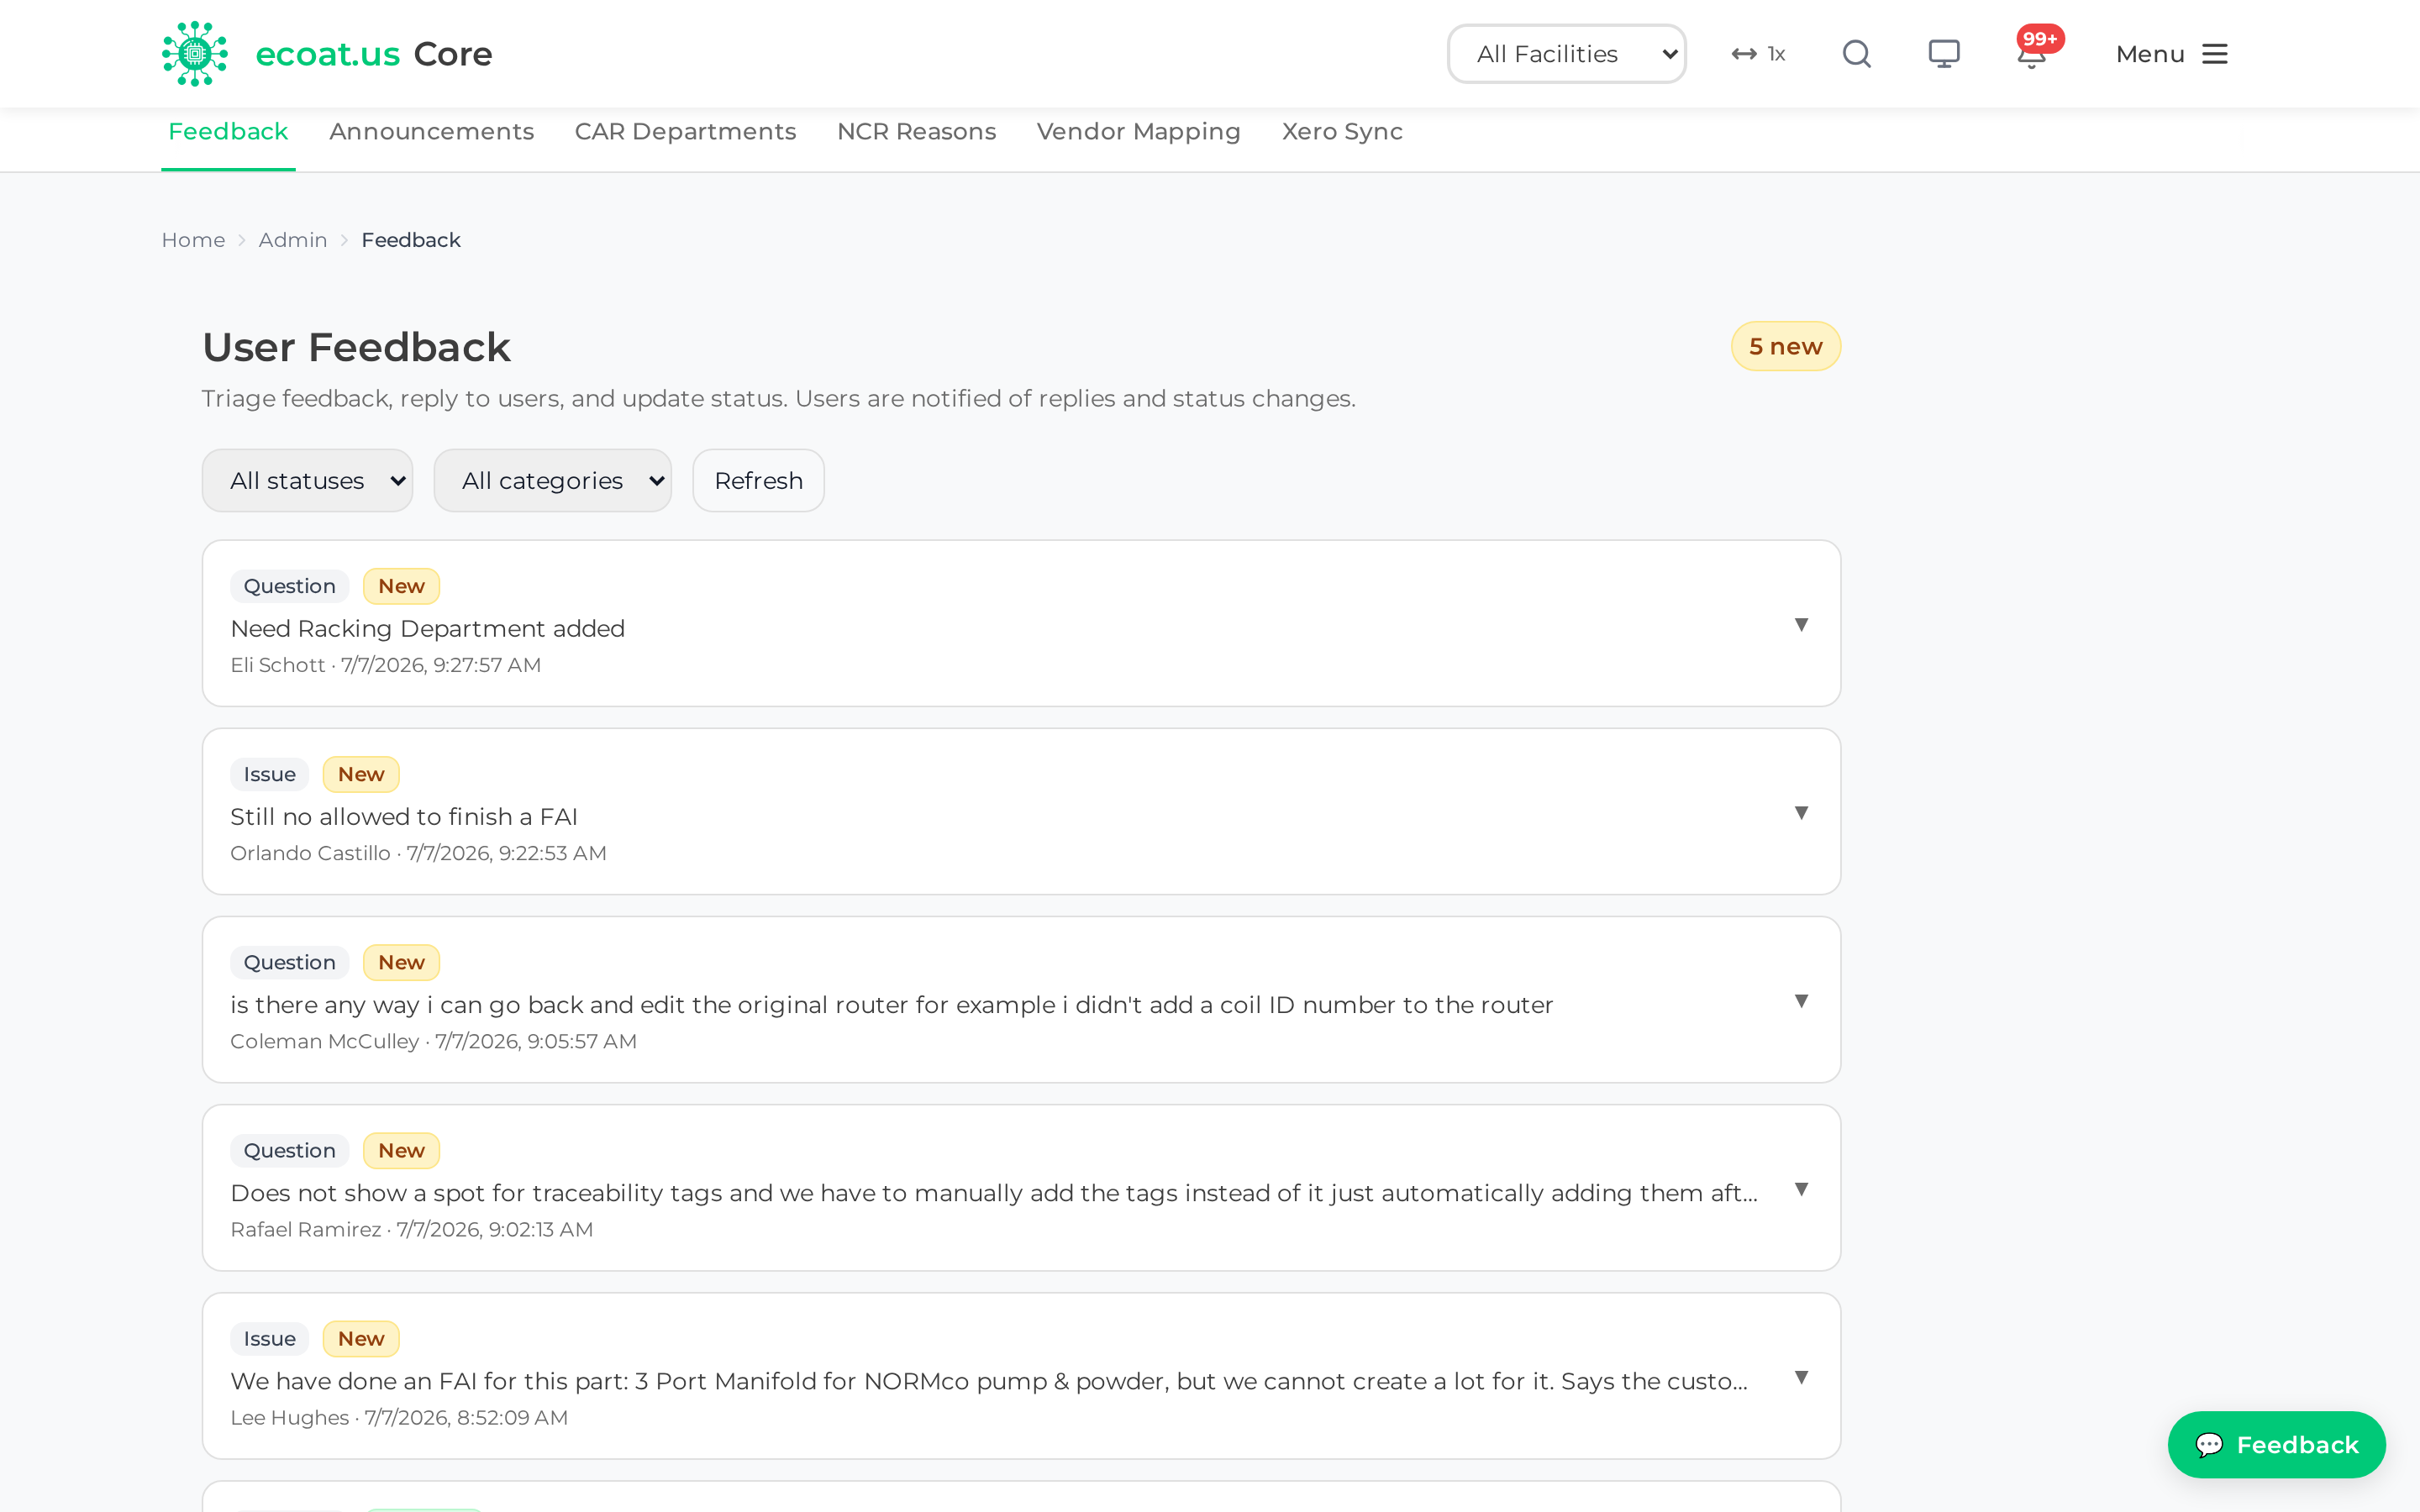
Notification settings (for everyone)
If CORE is sending you notifications that aren't yours, you can turn them off yourself. Notification settings is open to every signed-in user — there's no permission gate and nothing to request from IT.
Getting there: click the notification bell in the top bar, then Settings at the top of the panel. (The link is shown even when the bell is empty — an empty bell is exactly when you wonder whether it's working.) The address is /settings/notifications; it has no entry in the main menu, so it won't turn up in quick search (Ctrl+K).
The page lists every notification CORE can send, grouped by area — Production, Quality, Safety, Maintenance, Inventory & purchasing, Controlled documents, Helpdesk, Feedback, IT, and General. The list comes from the server, so a newly added notification type appears here automatically.
For each one you get two tick boxes:
- Bell — whether it shows in the in-app notification panel.
- Email — whether it lands in your inbox.
Some notifications also offer a scope box, so you can keep a type but narrow it — to particular plants, or particular customers. Leave a scope box empty to receive all of them. The boxes only appear for notifications that actually carry that dimension.
- Tick or untick Bell / Email per notification.
- Fill in any scopes you want to narrow.
- Click Save settings.
A line at the top tells you where you stand — "You currently receive everything", or a count of the types you've muted on the bell.
Note: A few notifications are addressed to you personally and can be narrowed but not switched off — a reply to your own feedback, for instance. Those show a note saying so and their tick boxes are greyed out.
The admin corner (for admins)
The following screens require administrator access (an @ecoat.us admin account). They control the option lists, mappings, and integrations that the rest of CORE depends on. Changes here ripple across every user, so go carefully.
The Admin menu itself lists six of them: Feedback, Announcements, CAR Departments, NCR Reasons, Vendor Mapping, and Xero Sync. GL Codes is not in that menu — see its section below for how to reach it.
Feedback triage
Route: /admin/feedback · Admin only
This is the other end of the feedback flow above. The User Feedback page lets you "Triage feedback, reply to users, and update status. Users are notified of replies and status changes."
- Filter the queue by status and category. A count of new items helps you see the backlog at a glance.
- Each item carries a status: New, Reviewed, or Resolved. Change it as you work the item.
- Reply to the submitter in the "Write a reply to the user…" box. Your reply is added to the thread and emailed to the person who submitted it — this is the threaded, two-way conversation they see in My Feedback.
Tip: Move an item to Reviewed once you've read it and Resolved when it's done. Because status changes notify the user, they always know their feedback didn't vanish.
Announcements
Route: /admin/announcements · Admin only
Create the IT announcements that appear on everyone's dashboard — the banners for outages, maintenance windows, and company notices. You set a title, message, type (Info, Warning, Critical, Maintenance), priority, optional start/expiry dates, and which facilities see it. This module is covered in full in its own help topic; the short version is that higher-priority announcements show first, and setting an expiry date keeps the dashboard tidy.
CAR Departments
Route: /admin/car-departments · Admin only
Maintains the list of departments that a Corrective Action Request (CAR) can be assigned to. Add, rename, or remove departments here. A department that has active CARs against it can't be deleted.
NCR Reasons
Route: /admin/ncr-reasons · Admin only
Maintains the reason codes for Non-Conformance Reports (NCRs). Add or edit reason codes and toggle them active or inactive — an inactive reason simply drops out of the dropdown when someone creates an NCR, without affecting past records.
Vendor Mapping
Route: /admin/vendor-mapping · Admin only
Links a vendor name in CORE inventory to its matching Xero contact, per facility. This mapping is what lets a purchase order sync to Xero automatically: when a PO is submitted, CORE looks up the vendor here, and if a mapping exists it creates a draft PO in the right facility's Xero organization. No mapping means the PO still saves locally but won't reach Xero. This module has its own detailed help topic.
GL Codes
Route: /admin/gl-codes · Admin only · not in the menu
You have to type this one in. GL Codes is a working page, but it has no entry in the Admin menu and it does not appear in quick search (Ctrl+K), because quick search is built from the menu. The only way in is the address itself — core.ecoat.us/admin/gl-codes. Bookmark it if you use it.
Manages the general-ledger (GL) codes that CORE offers when you assign an item to an accounting bucket. The page shows an overview of your codes broken down by cost category, plus the full catalog. Each code carries a GL Number (e.g., 121110), a Description (e.g., "Ecoat Inventory"), an Account Group, an Account Type, and optional Notes.
- Search by GL number, description, or group.
- Add or edit a code and set its group, type, and description.
- Only assigned codes appear in the Items dropdown; the page also flags codes that still need assignment ("Other/Do Not Know plus empty rows").
Tip: Keep the description meaningful — it's what buyers and accounting see in the Items dropdown, so a clear label prevents mis-coded inventory.
Xero Sync
Route: /admin/xero-sync · Admin only
Sync to Xero by E-PN is a manual tool for pushing specific inventory items to Xero on demand. As the page explains: "Push specific items to Xero by ECOAT part number. Each E-PN is pushed at every facility it exists at, to that facility's Xero organization. Safe to re-run — it updates the existing Xero item if one already exists."
- Paste one or more ECOAT part numbers (E-PNs) into the box — commas, spaces, or new lines all work (e.g.,
E000035, E000036, E000362). - Optionally leave Refresh last-purchase price before pushing checked (recommended).
- Click Push to Xero.
- A results table shows each part's Status — a green ✓ Synced, or the Xero item / error if something went wrong.
Tip: Because the push is safe to re-run, use this whenever an item's details or price changed and you want Xero to catch up — it updates the existing Xero item rather than creating a duplicate.
Permissions: Every screen in this section is administrator-only. Regular users interact with the results of these settings — the announcements on their dashboard, the reason codes in a dropdown, the reply in their inbox — but never these configuration pages themselves.
Note: Automatic Xero PO sync is currently disabled — vendor mappings are kept current for when it returns, but today every submitted PO is entered in Xero manually via the Buyer Worklist.